How has US intergenerational mobility changed since 1940?


Get involved with our crowdsourced digital platform to deliver impact at scale
Stay up to date:
Economic Progress
Intergenerational mobility is an important social objective for many individuals and policymakers, and may affect public attitudes toward other social objectives such as equality and growth (Piketty 1995, Benabou and Ok 2001, Corak 2013). However, surprisingly little is known about intergenerational mobility variation over time, space and groups. The main empirical problem is that measuring intergenerational mobility requires data on labour market outcomes for both parents and children. No standard government data set has collected this information historically in the US. Many panel data sets contain this information but they begin in the 1960s and are too small to examine mobility over time or subgroups with precision (e.g. Lee and Solon 2009). While new administrative data sets are improving intergenerational mobility estimation in more recent periods, they do not shed light on long-term historical trends and they lack information on individual race and parental education (Chetty et al. 2014). The lack of reliable, longer-term trends is unfortunate because the high school movement, early GI Bills (formally known as Servicemen’s Readjustment acts), Great Society programmes, several key Supreme Court decisions, and the Civil Rights movement all predate the availability of most panel data sets.
Measuring intergenerational mobility in census data
In this column I discuss a new method to estimate intergenerational mobility statistics on US census data (Hilger 2015). Prior research on intergenerational mobility has largely ignored census data. This is because the census only links parent and child outcomes while children still live with parents, and children rapidly become independent after age 17 but before any adult outcomes can be observed meaningfully (Cameron and Heckman 1993). I develop a simple adjustment for these ‘missing’ independent children that allows for estimation of the relation of children’s final schooling to their parents’ final schooling or their parents’ income. The main insight is that children who live independently from their parents in their mid-20s are much more similar to children who still live with their parents at these ages than researchers had previously assumed. Figures 1-3 show this insight for recent decades in a leading panel data set, the Panel Study of Income Dynamics, by plotting children’s final schooling at ages 22-25 by parental education and income, respectively. Figure 3 shows this again for parental home values in a panel linking children from the 1930 and 1940 censuses. The key takeaway is that children’s average final schooling is related to parental characteristics for dependent and independent children in similar ways. I find that this assumption cannot be rejected in every panel data set in which it can be tested in the US historical record. The assumption makes it possible to adjust intergenerational mobility statistics in census data to account for the missing 65% of children who cannot be linked directly with their parents at ages 22-25 over the 1940-2000 period.
Figure 1. Schooling by parental schooling for dependent and independent children in the PSID, pooling years 1968-2011
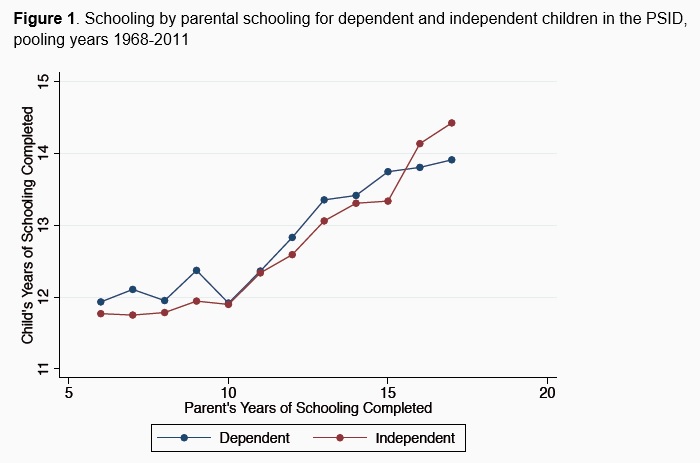
Figure 2. Schooling by parental income decile for dependent and independent children in the PSID, pooling years 1968-2011

Figure 3. Schooling by parental home value decile for dependent and independent children in matched 1930-40 census data

The resulting mobility estimates can also be validated directly against recent estimates from tax data in the 2000s. Figure 4 compares these mobility estimates by state. The figure suggests a striking correlation between the adjusted intergenerational mobility statistics in census data with conceptually analogous intergenerational mobility statistics based on administrative tax data covering the full US population. This congruence is not surprising given that the assumptions underlying the census adjustment appear valid.
Figure 4. Intergenerational mobility estimate in census data by intergenerational mobility estimate in tax data in 2000, by state

Long-term gains in mobility
The method outlined here opens up a wide range of new possibilities for research on intergenerational mobility because large, cross-sectional data sets such as the US census are more widely available over time and space than panel data sets. As a first application of the method, I examine long-term intergenerational mobility trends in the US. Figures 5 and 6 display children’s final schooling by parental final schooling and parental income deciles by year, focusing on the white population. The slope of these lines represents an inverse measure of relative mobility, because steeper lines indicate greater relative advantage for children born to parents with higher education or income. The figures reveal that relative intergenerational mobility increased dramatically 1940-60, may have increased modestly 1960-1980, and stabilised thereafter. The level and stability of intergenerational mobility after 1980 line up with recent findings in the US Panel Study of Income Dynamics (Lee and Solon 2009) and tax records (Chetty et al. 2014). However, the major increase after 1940 indicates that recent levels of intergenerational mobility are not a ‘deep’ fact about the US economy, and that intergenerational mobility increased at the same time inequality declined (Goldin and Margo 1992). I also replicate recent findings of lower intergenerational mobility in the South of the US, but place this finding in broader historical context of long-term regional convergence over many decades. Intergenerational mobility gains were also much larger among the black population, indicating the post-1940 gains in black education and income documented in Smith and Welch (1989) largely reflected gains among children born to less-advantaged black families.
These post-1940 gains in intergenerational mobility were economically large. Back-of-the-envelope calculations suggest that the educational gains of poor children implied by the increase in relative intergenerational mobility may have raised aggregate annual earnings growth over the 1940-1980 period by 0.125-0.25 percentage points. These gains are reminiscent of the gains in allocative efficiency from reductions in occupational barriers facing women and minorities after 1960 (Hsieh et al. 2013).
Figure 5. Schooling by parental schooling, 1940-2000

Figure 6. Schooling by parental income decile, 1940-2000

What caused the post-1940 mobility gains?
Over the 1940-1980 period, high school attendance increased dramatically among the poor relative to the rich. In contrast, the poor made zero gains relative to the rich in college attendance over the entire 1940-2000 period — a remarkable fact given the many programmes initiated over this period to encourage college attendance of low-income children, and the stark contrast between ‘free’ high schools and privately-financed colleges in the US. Increases in relative intergenerational mobility were therefore driven by high school attendance rather than college attendance. Along with the fact that gains were similar across gender and concentrated in years before 1960, the results argue against simple explanations based on the GI Bill, the War on Poverty or the Civil Rights Acts. The gains are likely related to increases in school quality over the post-1940 period, especially for black people (e.g. Card and Krueger 1992, Donohue III et al. 2002), which allowed low-income children to participate belatedly in the ‘high school movement’ that had affected higher-income children earlier in the 20th century (Goldin 1998). I also find that, conditional on region and year, intergenerational mobility by state of birth is positively correlated with higher state income levels, lower income inequality, greater educational inputs, higher minimum dropout ages, and lower teen birth rates. Demonstrating clear causal mechanisms for post-1940 intergenerational mobility gains remains a task for future research.
Prior literature
Prior literature has found mixed results on post-war trends in intergenerational mobility in the US. Hertz (2007) and Lee and Solon (2009) document stable mobility in child earnings since the 1970s, while Chetty et al. (2014) confirm stable mobility in child income since 2000. Chetty et al. (2014) estimate actual and predicted intergenerational mobility for children born in 1970-1990, using child outcomes observed in the years 1999-2012. I replicate these findings for recent decades, but place them in a broader historical context. Aaronson and Mazumder (2008) develop a different method to estimate intergenerational mobility statistics on census data back to 1950 by instrumenting for parental income with cohort and state of birth. They find mixed results on intergenerational mobility trends before 1980 and declining intergenerational mobility after 1980. Olivetti and Paserman (2014) and Clark (2014) estimate trends in intergenerational mobility before 1940 using information about socioeconomic status contained in children’s first and last names, respectively. As these authors are all careful to point out, their approaches depend on the strong and partly unverifiable assumption that instruments (state of birth, last name, first name) only affect child outcomes through parental characteristics, or that biases induced by violations of this assumption are constant over time. In contrast, the approach outlined here and developed in Hilger (2015) relies on weaker and more verifiable assumptions, at the cost of focusing on children’s final schooling rather than earnings or income. The method complements Olivetti and Paserman (2014) in that name data currently end in 1940, while income and education data begin in 1940. Finally, Long and Ferrie (2013) have compared long-term trends in intergenerational occupational persistence using both census and Occupational Changes in a Generation data. As they point out (Long and Ferrie 2013, footnote 14), occupational categories – unlike income and educational attainment – cannot be ranked cardinally over long periods of time. Moreover, reliance on Occupational Changes in a Generation data precludes analysis of many subgroups due to sample size limitations.
References
Aaronson, D, and B Mazumder (2008), “Intergenerational Economic Mobility in the United States, 1940 to 2000”, Journal of Human Resources 43 (1): 139–72.
Benabou, R, and E A Ok (2001), “Social Mobility and the Demand for Redistribution: The POUM Hypothesis”, The Quarterly Journal of Economics, May.
Cameron, S V, and J J Heckman (1993), “Comment on Trends in College Entry among Whites, Blacks, and Hispanics by Robert M Hauser”, in C T Clotfelter and M Rothschild (eds.) Studies of Supply and Demand in Higher Education, Chicago: University of Chicago Press, 61–120, January.
Card, D, and A B Krueger (1992), “School Quality and Black-White Relative Earnings: A Direct Assessment”, The Quarterly Journal of Economics 107(1): 151–200.
Chetty, R, N Hendren, P Kline, and E Saez (2014), “Where Is the Land of Opportunity? The Geography of Intergenerational Mobility in the United States”, The Quarterly Journal of Economics129(4): 1553–1623.
Chetty, R, N Hendren, P Kline, E Saez, and N Turner (2014), “Is the United States Still a Land of Opportunity? Recent Trends in Intergenerational Mobility”, The American Economic Review 104(5): 141–47.
Corak, M (2013), “Income Inequality, Equality of Opportunity, and Intergenerational Mobility”,Journal of Economic Perspectives 27(3): 79–102.
Goldin, C, and R A Margo (1992), “The Great Compression: The Wage Structure in the United States at Mid-Century”, The Quarterly Journal of Economics 107(1): 1–34.
Donohue III, J J, J J Heckman, and P E Todd (2002), “The Schooling of Southern Blacks: The Roles of Legal Activism and Private Philanthropy, 1910-1960”, The Quarterly Journal of Economics, February.
Goldin, C (1998), “America’s Graduation from High School: The Evolution and Spread of Secondary Schooling in the Twentieth Century”, The Journal of Economic History 58(2): 345–74.
Hertz, T (2007), “Trends in the Intergenerational Elasticity of Family Income in the United States”,Industrial Relations 46(1): 22–50.
Hilger, N G (2015), “The Great Escape: Intergenerational Mobility Since 1940”, NBER Working Paper 21217.
Hsieh, C-T, E Hurst, C I Jones, and P J Klenow (2013), “The Allocation of Talent and U.S. Economic Growth”, working paper.
Lee, C-I, and G Solon (2009), “Trends in Intergenerational Income Mobility”, The Review of Economics and Statistics 91(4): 766–72.
Long, J, and J Ferrie (2013), “Intergenerational Occupational Mobility in Great Britain and the United States Since 1850”, The American Economic Review 103(5): 2041–49.
Olivetti, C, and M D Paserman (2014), “In the Name of the Son (and the Daughter): Intergenerational Mobility in the United States, 1850-1940”, NBER Working Paper 18822.
Piketty, T (1995), “Social Mobility and Redistributive Politics”, The Quarterly Journal of Economics110(3).
Smith, J P, and F R Welch (1989), “Black Economic Progress After Myrdal”, Journal of Economic Literature 27(2): 519–64.
This article is published in collaboration with Vox EU. Publication does not imply endorsement of views by the World Economic Forum.
To keep up with the Agenda subscribe to our weekly newsletter.
Author: Nathaniel Hilger is an Assistant Professor of Economics, Brown University.
Image: A couple holds hands as they walk across a street in New York. REUTERS/Lucas Jackson
Don't miss any update on this topic
Create a free account and access your personalized content collection with our latest publications and analyses.
License and Republishing
World Economic Forum articles may be republished in accordance with the Creative Commons Attribution-NonCommercial-NoDerivatives 4.0 International Public License, and in accordance with our Terms of Use.
The views expressed in this article are those of the author alone and not the World Economic Forum.
The Agenda Weekly
A weekly update of the most important issues driving the global agenda
You can unsubscribe at any time using the link in our emails. For more details, review our privacy policy.
More on Economic ProgressSee all

Joe Myers
April 12, 2024

Joe Myers
April 5, 2024

Pooja Chhabria
March 28, 2024

Kate Whiting
March 28, 2024

Joe Myers
March 28, 2024

Andrea Willige
March 27, 2024