What do minimum wages look like in sub-Saharan Africa?


Get involved with our crowdsourced digital platform to deliver impact at scale
Stay up to date:
Future of Work
Most countries in sub-Saharan Africa have adopted minimum wage laws. Although the sectors and the fractions of workers covered are small given the low rates of formality and urbanisation in the region, this is an important step because:
- As the number of covered workers grows, wage regulation will become increasingly significant for the economy as a whole;
- There can be spillover effects on to uncovered sectors; and
- As we show in our work (Bhorat et al. 2015), wage regulation is particularly aggressive in sub-Saharan Africa.
Thus, current experience with minimum wages in the region is relevant for analysts and policymakers as we look forward to possible redesign of regulation in the future.
Minimum wage levels
Beyond the diverse regulatory frameworks across legislated minimum wages, the level at which the wage is set also varies substantially across sub-Saharan Africa, both by geographical region and by the income group that a country falls into. Figures 1 and 2 plot levels of GDP per capita against the level of minimum wages, for SSA and non-SSA countries. They suggest that minimum wage levels in non-SSA countries are not only higher relative to levels of GDP compared to minimum wage levels in SSA countries, but are also more responsive to increases in GDP relative to SSA countries.
Figure 1. Monthly minimum wages and GDP per capita in Sub-Saharan Africa (US$ PPP)

Sources: ILO global wage database, World Bank WDI
Note: Sample based on 37 African economies, where the latest available data for each country was utilised.
Figure 2. Monthly minimum wages and GDP per capita, non-SSA developing countries (US$ PPP)

Sources: ILO global wage database, World Bank WDI
Note: Sample based on 67 non-SSA developing economies, where the latest available data for each country was utilised.
Table 1 presents country-level data for 21 SSA countries. We focus on the average level of the minimum wage, the mean wage, and the Kaitz ratio (minimum-to-mean wage). For the region, the mean of the Kaitz ratio is 58% and the median is 31%. However, the Kaitz ratio is substantially higher for low-income countries, where the group median is 0.16 points above the median for lower-middle income countries in the region, and 0.26 points above the upper-middle income countries median. Simply put – low-income African countries are setting higher minimum wages relative to their domestic mean wages, compared with both lower and upper-middle income economies in the region.
Table 1. Monthly minimum wage estimates in sub-Saharan Africa

Sources: ILO Global Wage database, World Bank WDI
Note: Sample based on 21 economies, where the latest available data for each country was utilised. Wages are monthly and shown in current US$ PPP.
Employment consequences
There is limited research on the employment effect of minimum wages in Sub-Saharan Africa. The most comprehensive literature in the region exists for South Africa and shows that while the introduction of minimum wages had a negative impact on employment in agriculture and to some extent in the clothing sector, no employment decreases were evident in all other covered sectors (Dinkelman and Ranchhod 2012, Bhorat et al. 2013b, Nattrass and Seekings 2014). Overall, analysis for the four SSA countries for which this question has been studied (Ghana, Kenya, Malawi, and South Africa) produces findings that are consistent with the broad summary of global research.
We reviewed employment estimated in the minimum wage literature to date. This includes the 98 papers reviewed in Neumark and Wascher’s (2007) work and 17 more recent studies focused on low- and middle-income countries not included in Neumark and Wascher (2007). Where a study produced elasticity estimates for more than one cohort of workers, we consider each estimate separately. But we only consider those estimates that were statistically significant, and it is worth noting that 55% of reported elasticity estimates reviewed were not statistically significant.
Figure 3 shows employment elasticities for low- and middle-income countries only. The median elasticity is -0.08, while the mean is -0.11 (these are shown as the horizontal broken lines in Figure 3). By and large, introducing and raising the minimum wage in lower-middle-income countries has a small negative impact, or no measurable negative impact. However, there is significant variation around this average finding. The employment elasticities are neither constant nor linear. Where increases in a minimum wage are large and immediate, this can result in employment losses, but more modest increases usually have little observably adverse effects on employment, and may have positive impacts on wages.
Figure 3. Minimum wage-employment elasticities for low- and middle-income countries

Source: Neumark & Wascher (2007) and authors’ calculations.
Minimum wage compliance
The great variability in findings on employment can be explained partly by the great variation in the detail of the minimum wage regimes and schedules in the difference countries (Bhorat et al. 2015), but also by the variations in compliance. While the Kaitz ratios presented above are indicative of widespread non-compliance with minimum wage laws, a more robust method is required to investigate it further. We apply an index of violation from Bhorat et al. (2013a) to calculate the level and depth of non-compliance, which provides a more comprehensive picture. The index of violation allows us to calculate the level of non-compliance, or V0, which is simply the percentage of workers who earn below the minimum wage that applies to them. It also allows us to go beyond this to calculate the depth of this non-compliance, or V1, which measures how far below the minimum wage these workers earn, on average.
The data in Figure 4 clearly show that for most countries in the SSA region, non-compliance is widespread. On average, 58% of workers earn below the minimum wage legislated for them. This is compared to an average of 30% for the non-SSA countries in the figure. Figure 4 also highlights the cross-country differences in levels of non-compliance. In Zambia, approximately 36% of workers earn sub-minimum wages, while this rises to 80% in Tanzania. These numbers reinforce the picture provided by the Kaitz ratios above, where minimum wage rates were shown to be set high relative to average wages.
Figure 4. Average compliance rates (V0), African and developing country comparison
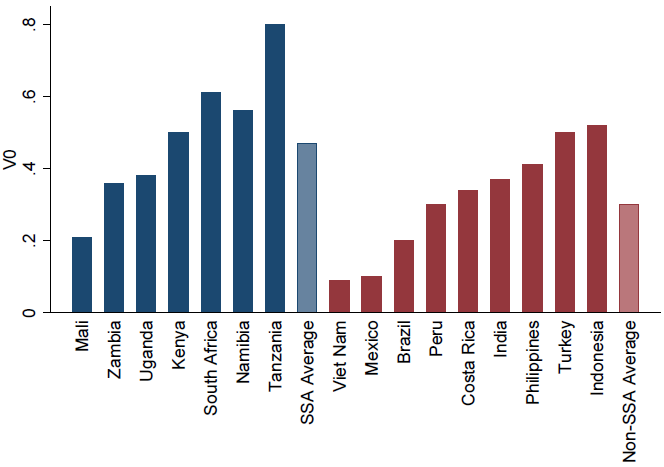
Source: Authors’ calculations, and Rani et al. (2013)
Figure 5 moves beyond the level of compliance to explore how far below the minimum wage workers are on average. Comparing Figures 4 and 5, absolute levels of non-compliance are higher in Africa, whilst relative levels of non-compliance are higher in non-African developing countries.
Figure 5. Average depth of non-compliance (V1), African and developing country comparison

Source: Authors’ calculations, and Rani et al. (2013)
Conclusion
Our work provides an empirical overview of minimum wages in sub-Saharan Africa (Bhorat et al.2015). Minimum wages are relatively high, but non-compliance is relatively high as well, and perhaps for this reason the employment consequences of minimum wages are not particularly strong. It is evident that research in this area is still at a very early stage, and our first cut analysis is in essence attempting to craft the broad contours of the extent and nature of minimum wage setting on the continent. Whilst work on minimum wages is fairly mature in many OECD countries, our understanding of minimum wage policy and its impact in sub-Saharan Africa is not. This is in large part due to a severe lack of necessary data. The release of country-level earnings and employment data at regular intervals lies at the heart of a future, country-focused, minimum wage research agenda for Africa.
References
Bhorat, H, R Kanbur, and N Mayet (2013a), “A Note on Measuring the Depth of Minimum Wage Violation”, Labour, Vol. 27, No. 2, pp. 192-197.
Bhorat, H, R Kanbur and N Mayet (2013b), “The impact of sectoral minimum wage laws on employment, wages, and hours of work in South Africa”, IZA Journal of Labor & Development, 2(1), 1-27.
Bhorat, H, R Kanbur, and B Stanwix (2015), “Minimum Wages in Sub-Saharan Africa: A Primer”, CEPR Discussion Paper No. 10760.
Dinkelman, T and V Ranchhod (2012), “Evidence on the impact of minimum wage laws in an informal sector: Domestic workers in South Africa”, Journal of Development Economics, 99(1), pp.27-45.
Nattrass, N and J Seekings (2014), “Job destruction in Newcastle: minimum wage-setting and low-wage employment in the South African clothing industry”, Transformation: Critical Perspectives on Southern Africa, 84(1), pp.1-30.
Neumark, D and W Wascher (2007), “Minimum Wages and Employment”, Discussion Paper No. 2570. Bonn: Institute for the Study of Labor (IZA).
Rani, U, P Belser, M Oelz, and S Ranjbar (2013), “Minimum wage coverage and compliance in developing countries”, International Labour Review, 152(3-4), pp.381-410.
This article is published in collaboration with VoxEu. Publication does not imply endorsement of views by the World Economic Forum.
To keep up with the Agenda subscribe to our weekly newsletter.
Author: Haroon Bhorat is a Professor of Economics and Director of the Development Policy Research Unit (DPRU) at the University of Cape Town. Ravi Kanbur is a T. H. Lee Professor of World Affairs, International Professor of Applied Economics and Management and a Professor of Economics at Cornell University and CEPR Research Fellow. Benjamin Stanwix is a Senior researcher at the Development Policy Research Unit (DPRU) at the University of Cape Town.
Image: A customer conducts a money transfer. REUTERS/Thomas Mukoya.
Don't miss any update on this topic
Create a free account and access your personalized content collection with our latest publications and analyses.
License and Republishing
World Economic Forum articles may be republished in accordance with the Creative Commons Attribution-NonCommercial-NoDerivatives 4.0 International Public License, and in accordance with our Terms of Use.
The views expressed in this article are those of the author alone and not the World Economic Forum.
Related topics:
The Agenda Weekly
A weekly update of the most important issues driving the global agenda
You can unsubscribe at any time using the link in our emails. For more details, review our privacy policy.
More on Jobs and the Future of WorkSee all

Eli Joseph
April 19, 2024


Kate Whiting
April 17, 2024

Juliana Guaqueta Ospina
April 11, 2024

Victoria Masterson
April 9, 2024

Jacqueline Brassey, Lars Hartenstein, Patrick Simon and Barbara Jeffery
April 3, 2024