These 10 charts show how we can reimagine Europe’s economy

A number of structural weaknesses have emerged in the EU economy since the global financial crisis. Image: REUTERS/Staff


Get involved with our crowdsourced digital platform to deliver impact at scale
Stay up to date:
Innovation
Europe is at risk of falling behind its global competitors. In a period of radical technological transformation, European firms are investing too little, with a gap both in tangible and intangible investment compared to the US. This column calls for a ‘retooling’ of Europe’s economy in relation to skills, innovation finance, the business environment, infrastructure, and deepening the Single Market.
Over the last year, we have seen a notable re-emergence of concerns with regard to the medium- and long-term economic outlook. In its latest forecast, the IMF (2018) draws attention to “powerful structural headwinds acting on potential growth” that have only temporarily been offset by cyclical factors. Likewise, the European Commission (2018) projects moderate economic growth that faces significant downside risks, despite supportive financing conditions.
A range of structural factors explains Europe’s relatively low rate of productivity growth and overall potential growth. Well-known and relatively well-studied is the enduring gap between the EU and the US in R&D investment (Van Ark et al. 2008, Moncada-Paternò-Castello et al. 2010, Cincera and Veugelers 2014) and other intangibles (Haskel and Westlake 2017). Recent work has also examined the role of the diffusion of innovation between and within countries (Andrews et al. 2015, Cirera and Maloney 2017), while Gopinath et al. (2017) and Restuccia and Rogerson (2017) discuss causes and costs of capital misallocation. But there are also many factors to be considered, such as skills constraints (Cedefop 2018), market size, and the recent, less well-known divergence in the investment rates in machinery and equipment between the EU and the US.
The EIB Investment Report 2018/2019 (EIB 2018) provides a comprehensive analysis of investment and investment finance in Europe.1 Building on the latest findings of a unique annual survey of 12,500 firms across Europe,2 it analyses structural and cyclical factors influencing investment in various assets classes, opening a window on some of the weaknesses of the EU economy, the likely cost of inaction, and what a ‘retooling’ should entail.
After a strong investment recovery, headwinds are strengthening, and structural challenges remain
Investment has been clearly recovering in Europe, on the ground of supportive monetary policy and financing conditions. The intensity of investment in the EU, relative to GDP, is now close to its long-term average level. Its recovery has been driven by investment in machinery and equipment and intangibles, with investment in dwellings and structures now also picking up. Monetary and financial conditions have supported this recovery: the cost of borrowing for businesses is still historically low, and the share of firms in the EIB Investment Survey (EIBIS) that name access to finance as a major impediment to investment is low and declining at 17%.
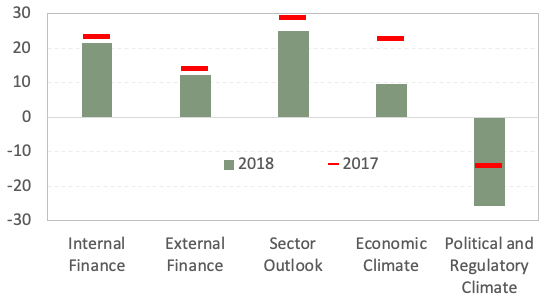
However, headwinds are strengthening, adding to long-lasting concerns about low potential growth. EIBIS asks firms to assess the relevance of different factors in influencing investment activities. The net share of firms considering the general economic climate as supportive for investment has declined relative to 2017, while the net share of firms considering political and regulatory conditions as negative for investment has substantially increased. This is an early indication of changing sentiment, with Brexit, rising social tensions, political polarisation, and increasing economic risk contributing to rising uncertainty.
Figure 1 Headwinds are strengthening (firms considering each factor supportive, minus firms considering it negative)
Structural weaknesses in the EU economy
In a period of disruptive technological transformation, Europe’s recovery has actually been relatively weak, at least in relation to the US experience. Since the crisis, a gap has opened up in investment in machinery and equipment. While some of this effect is related to the shale boom in the US, it also raises questions about whether the EU will be able to keep up in terms of technological transformation, with widespread adoption of new technologies.
Figure 2 Investment gap, EU vs US (machinery & equipment and intangibles, % of GDP)
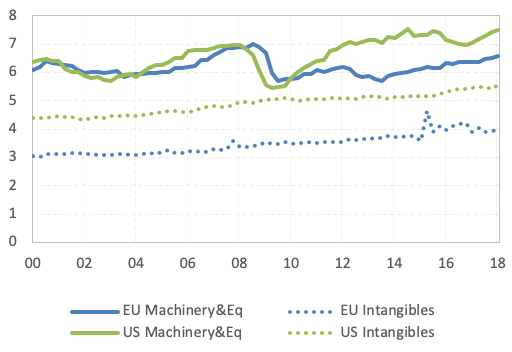
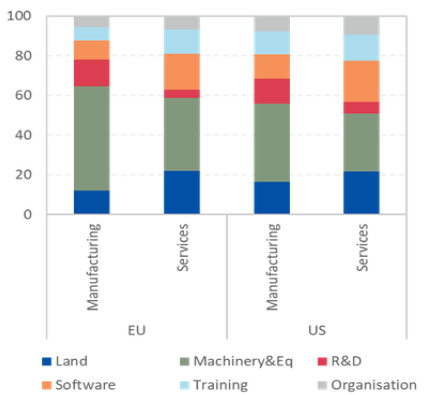
This gap in tangible investment is even more worrisome when viewed in combination with the well-known gap in investment in intangibles. European firms still fail to see the need to invest in different forms of intangibles to internalise complementarities across different forms of investment. R&D is not the only important form of intangible investment. Investment in software, skills, and organisational transformation are all becoming essential elements in the new digital world, both in the manufacturing and the service sectors.
Figure 3 European firms invest less in intangibles (% of total firm investment)
At the forefront of the innovation process, the EU also shows a concerning lack of dynamism. Based on EIBIS data, we can categorise firms according to whether they do not innovate, just adopt innovations, conduct R&D, or are ‘leading innovators’ who are both doing R&D and introducing globally new products. What we see is that the EU, compared to the US, has more firms that do not innovate at all or that only adopt innovations. Where Europe is really lagging behind is in terms of leading innovators, particularly among young firms. This is a symptom of a more static system, where fewer young firms succeed in displacing older rivals.
Figure 4 Europe has less leading innovators (innovation profiles by age of the firm, %)
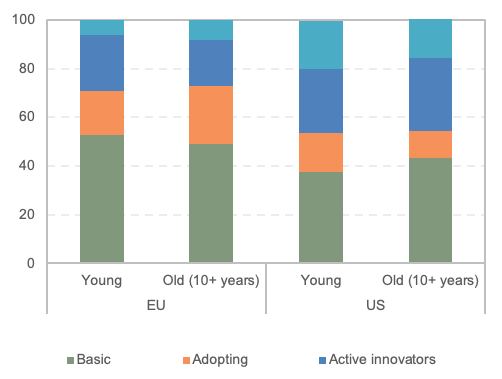
Note: Innovation profiles are defined based on firms’ spending on R&D and firms’ introduction of products and processes new to the firm, country or world.
When we look at the top firms globally for R&D expenditure, what we see is not only the dramatic rise of China but also a relative lack of dynamism in Europe, with fewer new entrants since 2011 among the top firms, compared to the US. This is also accompanied by the much lower presence of European firms in high-tech sectors.
Figure 5 Europe has fewer ‘new’ global leaders (share of top 2,500 R&D global spenders, %)
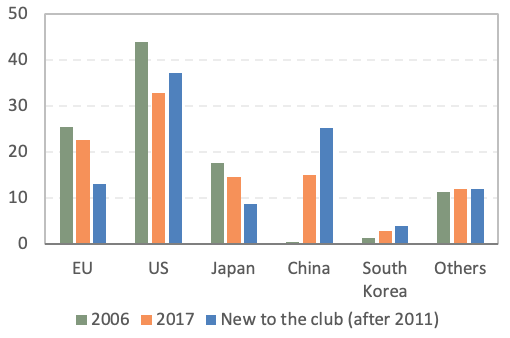
Note: % firms in the top 2,500 R&D global spenders in 2006 and 2017, and % of new entrants to this group after 2011
One of the constraints facing innovation and technological transformation in Europe is finance. The European financial sector is largely bank-based, with banks being relatively unsuited to financing innovation and intangible investments. While the cost of debt now stands at around 400 basis points below its pre-Global Crisis level, the cost of equity has not fallen to such an extent. The equity risk premium remains elevated and the spread between equity and debt is still larger than before the crisis. Private equity, venture capital and listed equity funding all lag behind the US and advanced Asian countries on several fronts, leaving European firms more dependent on bank lending and weakening resilience to financial shocks.
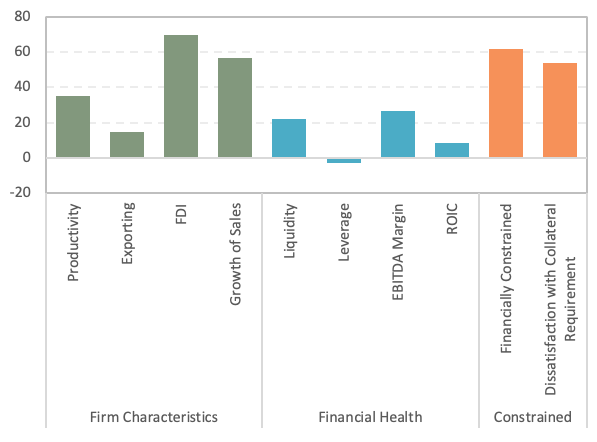
The effects of this are visible in EIBIS data. When we compare innovating with non-innovating firms, we see that the innovators show better performance and financial health, yet are significantly more likely to be financially constrained. Their dissatisfaction with the collateral requirements for bank credit is also particularly marked, as you would expect for firms investing in intangibles such as intellectual property.
Figure 6 Difference between innovating and non-innovating firms (% deviation from non-innovators, defined as non-patenting firms)
Skills present another constraint: 77% of European firms consider the limited availability of staff with appropriate skills to be an impediment to investment. This skills gap reflects a structural process of adjustment to changing technology and skill requirements, exacerbated by a tight labour market in many EU countries and migration in Central and Eastern Europe. At the firm level, it is the more innovative firms that more often report limited skills availability as a constraint. Seventy-one percent of EU firms invest in training, but only 21% consider that their recent investment in training has been sufficient. This may partially reflect the difficulty firms face in internalising benefits from training, pointing to the importance of public action in this area.
Figure 7 Lack of skills, by firms’ innovation profile (firms that consider lack of staff with the right skills an impediment to investment, %)

Quality infrastructure is another vital economic enabler, but investment in infrastructure in the EU is lagging the recovery. At 1.7% of GDP, it now stands at about 75% of its pre-Financial Crisis level and shows only little sign of an upturn. This does not appear to be a response to need saturation: the fall in investment is not correlated with infrastructure quality and one in three large municipalities in Europe say that infrastructure investment is still below needs. Instead, it reflects a shift in public investment away from infrastructure during the crisis. Along with a retrenchment of the public sector, the capabilities to generate projects has been declining. Finance is not the only gap. Planning capacity is poor as well as project generation capacity. A new narrative is needed, as well as clearer incentives for the private and public sector to cooperate.
Figure 8 Infrastructure investment remains low (investment in infrastructure, % of GDP)
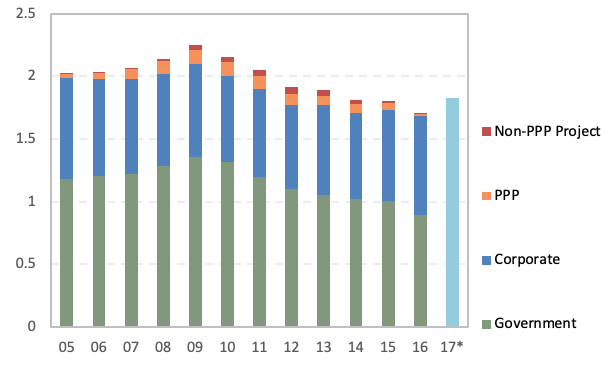
Note: * Provisional estimate.
In addressing these weaknesses, the institutional framework will be key. Forty-three percent of municipalities regard technical capacity for planning and project generation as a major obstacle. Difficulties in properly structuring public-private partnerships mean that incentives for private sector operators are unclear. We also see that firms are three times more likely to innovate and nine times more likely to introduce a patent in regions that score well on indicators of institutional quality. Meanwhile, firms consider both business and labour market regulations to be significant impediments to investment.
Figure 9 Long term barriers to investment (% firms reporting impediment to investment)

In the face of disruptive digital technologies and a global race for technological leadership, the cost of inaction is high
Our EIBIS survey module on digitalisation and skills, covering 1,700 firms in the EU and the US, is a first direct comparison of achievement in digitalisation in the EU and the US. The results of the survey suggest that firms that adopt digital technologies tend to be more productive, invest more, and engage more in innovation activities. They also credit the adoption of digital technologies with increased sales: 50% more firms in manufacturing and over 60% more in services believe that their sales would have been lower, had they not adopted digital technologies.
More worryingly, digitalisation appears to be creating winner-takes-all dynamics. On the one hand, digitalisation is associated with higher markups, suggesting a lack of competition. On the other, the most productive digitalised firms stand out in expecting, on balance, that digitalisation will lead to a decrease in the competition they face. These dynamics suggest that late adoption of digital technologies could have disproportionate and long-lasting effects on competitiveness.
In the context of the growing relevance of disruptive technologies, there is a cost of inaction. Thus far, in the manufacturing sector, European firms have kept pace with their US counterparts in terms of digital adoption, but in the service sector, EU firms are lagging. Moreover, when one looks at the most advanced forms of digitalisation (internet of things, big data, and software development), the digital gap between Europe and the US is more evident.
Figure 10 Will digitalisation increase competition? (expectations by productivity quintiles for fully and not-fully digital firms)
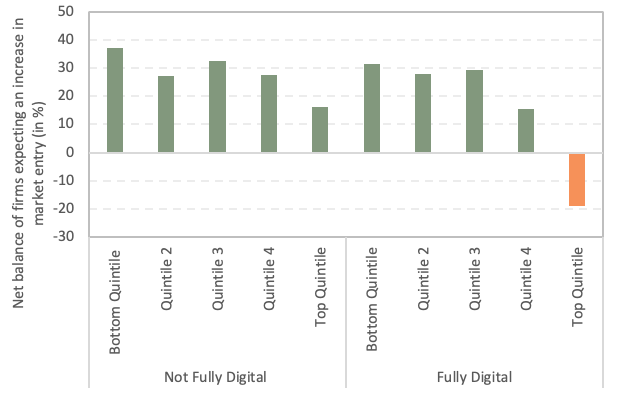
Note: Firms are grouped by quintile in terms of total factor productivity. The graph shows the percentage of firms that expect digitalisation to increase competition minus those that expect competition to decrease (net value).
We need to retool Europe’s economy
Europe’s economy still lacks the ‘tools’ to meet the urgent challenges of the future: remaining globally competitive in the face of rapid innovation and digitalisation, achieving sustainability, and creating an inclusive and cohesive society. This requires a response at all levels, and not least at the European level. European cooperation is needed to facilitate the allocation of European savings towards the most productive use, overcoming investors’ home bias. This means advancing financial integration through the CMU and Banking Union. It also means making full use of EU instruments such as the EIB and the EU budget.
Our analysis also points to key areas for attention:
- Encouraging a dynamic, innovative business environment through improving regulatory conditions for firm growth, and market entry and exit, and through addressing the ‘equity gap’ and ‘growth stage trap’, on the demand and supply sides.
- Committing to market efficiency through further deepening the single market, particularly for services (crucial for digitalisation incentives), and through creating the conditions for a true European digital market.
- Unblocking critical investment in infrastructure and innovation through better infrastructure governance, complementing finance with technical capacity, and through support to innovation and adoption of new technologies, focusing on all intangibles, not only R&D, and considering the complementarities between asset classes and private/public investment.
- Working together to close the skills gap, an issue that provides an opportunity for win-win policies that address both competitiveness and social inclusion, and where there is potential for more coordinated action at the EU level.
Retooling Europe must be socially and environmentally sustainable, taking into account the impacts of automation on jobs and demand for skills, issues of cybersecurity and data governance, and, not least, the need for a step-change in investment in climate change mitigation.
Don't miss any update on this topic
Create a free account and access your personalized content collection with our latest publications and analyses.
License and Republishing
World Economic Forum articles may be republished in accordance with the Creative Commons Attribution-NonCommercial-NoDerivatives 4.0 International Public License, and in accordance with our Terms of Use.
The views expressed in this article are those of the author alone and not the World Economic Forum.
Related topics:
The Agenda Weekly
A weekly update of the most important issues driving the global agenda
You can unsubscribe at any time using the link in our emails. For more details, review our privacy policy.
More on Geographies in DepthSee all

Andrea Willige
April 23, 2024

Libby George
April 19, 2024

Apurv Chhavi
April 18, 2024

Efrem Garlando
April 16, 2024

Babajide Oluwase
April 15, 2024

Rida Tahir
April 9, 2024