12 years of European economic growth, in just two maps

Europe's economic growth looks very different on a map. Image: REUTERS/Jas Lehal


Get involved with our crowdsourced digital platform to deliver impact at scale
Stay up to date:
European Union
Economic growth has been markedly different across EU regions. The fastest-growing regions of the EU between 2003 and 2015 were in Bulgaria, Poland, Romania, Slovakia the three Baltic countries and in the southern part of Ireland (Map 1). On the other end, Greece experienced a particularly dramatic recession, while most regions of Italy and many regions in France, Spain and the United Kingdom are also among the slowest growing regions.
Map 1: GDP per capita growth in EU regions, 2003-2015
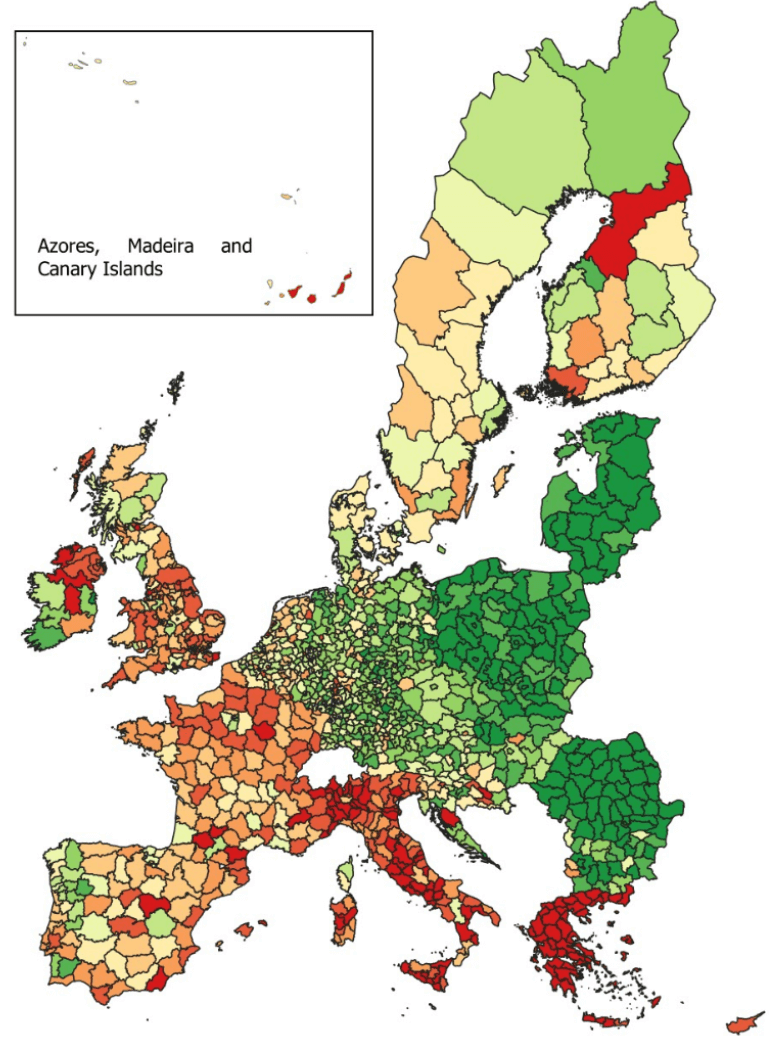
Note: colours refer to different deciles in terms of GDP growth per capita measured at purchasing power standards (PPS). Regions in dark green grew the most, whereas regions in dark red grew the least or even suffered from a decline.
While per-capita GDP growth is a useful indicator of economic development, we need a benchmark to assess whether growth was relatively ‘fast’ or ‘slow’ compared to the potential of the particular region. To take an example from sport, running 100 metres in 15 seconds would be a poor result for the eight-time Olympic gold medallist Usain Bolt, but would be a fantastic result for a 70-year old grandma.
In a recent research paper we prepared for the European Parliament (see its summary here), we establish a benchmark growth rate for each of 1,337 European regions in 2003-2015, by econometric estimates. We consider the period of 2003-2015 for data availability reasons, but also with a view to having several years both before and after the most acute phases of the 2008 global and European financial and economic crisis.
By drawing on economic theory we consider numerous determinants of economic growth. Our strategy is to quantify the impacts of region-specific growth drivers to obtain the benchmark rate of growth, which we then compare to actual growth. We interpret the gap between these two indicators as ‘unexplained economic growth’, which is a better measure for assessing the economic success of a region than actual growth.
Our estimates confirmed the importance of the following region-specific characteristics:
- The initial level of GDP at purchasing power standards (PPS) per capita in 2003: Less advanced areas should enjoy relatively higher marginal productivity of production factors, thereby advancing towards their long-run GDP per capita equilibrium level. For example, the level of GDP per capita is much lower in Bulgaria than in Germany, which is to a large extent driven by technological differences: production in Germany uses more advanced technologies than in Bulgaria. Thereby, Bulgaria has a higher potential to grow than Germany, because Bulgaria could adopt the existing best technologies and thereby catch up with Germany, while German growth is determined by the development of new technologies, which tends to be a more difficult and slower process.
- The capital-to-output ratio in 2003: A higher proportion of capital over output suggests that the economy is at a more advanced stage of development and therefore has less scope for catching up, lowering the growth potential.
- The percentage of employment in the services sector in 2003: Similarly, a higher share of services-sector employment suggests a more advanced stage of development, lowering the growth potential.
- The change of services-sector employment in 2003-2015: Such a change reflects a fundamental structural shift in the economy, lowering the growth potential.
- Research and development (R&D) personnel in percentage of total employment in 2003: A higher share of R&D suggests a higher stock of human capital, which increases the long-run level of economic growth.
- The share of working-age people with tertiary education in 2003: Similarly, the higher the share of highly educated workers, the higher the expected long-run level of GDP per capita.
- Population density in 2003: This indicator is a useful measure of urbanisation, while urban regions with a higher share of employees who work neither in agriculture nor in manufacturing should be more advanced and closer to the technological frontier, and thereby having a lower potential for growth.
- The growth in population between 2000 and 2003: Higher population growth should imply a lower physical-capital-per-worker ratio and lower long-term GDP per capita.
- Quality of governance in 2010: Better governance is a reflection of effective, impartial and transparent institutions which enable economic growth.
It is reassuring that these variables, which have a theoretical rationale, are found to have a statistically significant influence on economic developments. We did not control for factors contemporaneous to the period of growth analysed – from 2003 to 2015 – to avoid certain econometric problems, with only two exceptions. First, the earliest regional institutional quality data available is for 2010. Second, the growth of the tertiary sector from 2003 to 2015 is a powerful driver of economic growth and it is important to include it in the regression.
Map 2 shows 1,337 EU regions according to their degree of unexplained economic growth.
Map 2: Unexplained economic growth in EU regions, 2003-2015
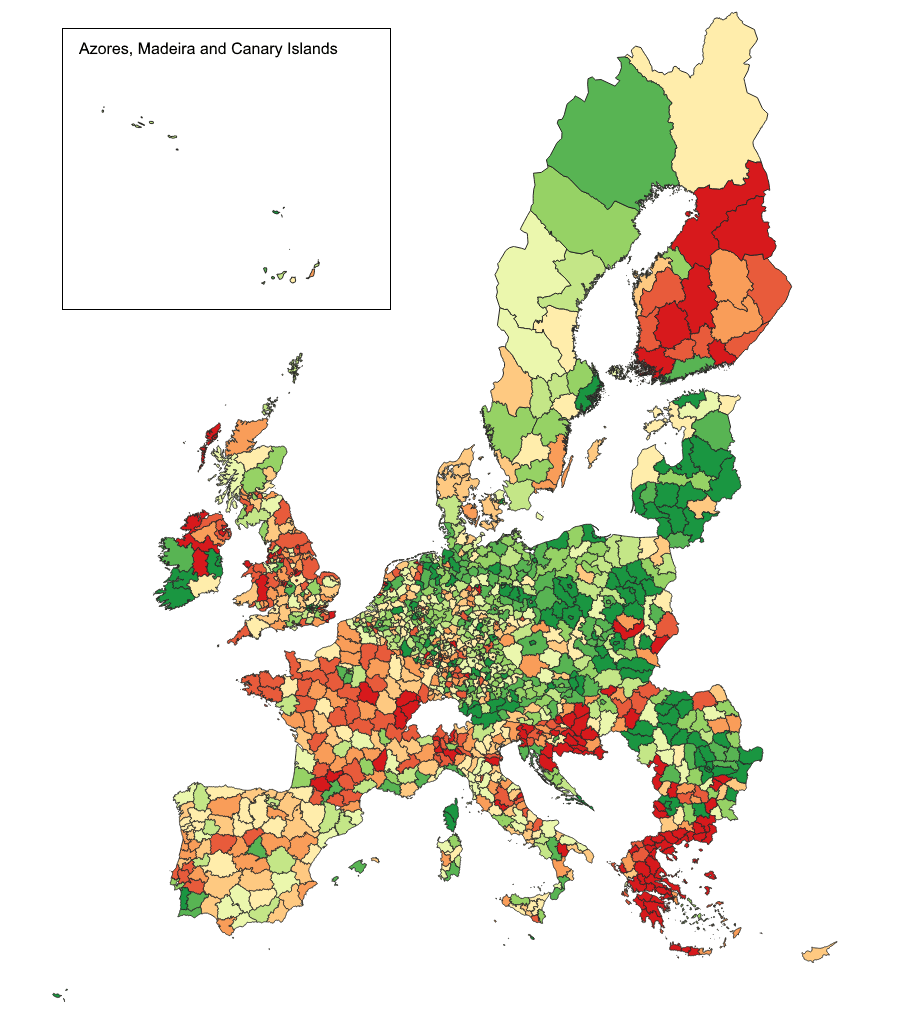
Note: Map based on deciles of the residuals of our conditional convergence model. Regions in dark green had the fastest unexplained economic growth, while regions in dark red the slowest.
There are some noticeable differences between Map 1 and Map 2. While on Map 1 the three Baltic countries, Bulgaria, Poland and Romania were dominated by the dark-green regions (indicating fast actual GDP growth), on Map 2 there are some yellow- or even red-coloured regions, suggesting poor performance relative to the benchmark. Finnish regions also rank poorer on Map 2 (with more red colours) than on Map 1. Italy, on the other hand, was rather red on Map 1, but there are some light-green spots on Map 2, indicating that – conditional on regional characteristics – there were a few successful regions within Italy.
In fact, among the 1,337 regions we considered, the top 10% of 133 regions comes from 21 countries, highlighting that there are rather successful regions, in terms of unexplained economic growth, in many EU countries. There are only seven EU countries that do not have a single region in the league of top 10% conditional-growth performers: Belgium, Cyprus, Finland, Greece, Hungary, Slovenia and Spain.
The unlucky group of the bottom 10%, the 133 regions with the worst economic performance, is from 14 countries, suggesting greater concentration. In particular, 36 of the 52 Greek regions (i.e. 69% of Greek regions) are in the bottom decile. Eight more sit in the second-worst decile and a further four in the third-worst decile, highlighting that Greece as a country suffered massively after 2008. There are some other countries too in which a very large share of regions belongs to the bottom 10% of EU regions: Croatia (48%), Slovenia (42%), Bulgaria (32%), Finland (32%), Hungary (30%) and Ireland (25%), suggesting a high-level of concentration of poor economic development and major differences within countries.
We therefore have three key messages.
- First, it is crucial to control for region-specific factors in assessing growth performance.
- Second, there are rather successful regions in many EU countries, suggesting that the EU can provide a good framework for growth.
- And third, the worst performers are more concentrated in some countries, suggesting that country-specific factors can play a major role in regional development.
How did EU cohesion policy contribute to regional growth and how should the policy be improved? Please check it out in our new policy contribution.
Don't miss any update on this topic
Create a free account and access your personalized content collection with our latest publications and analyses.
License and Republishing
World Economic Forum articles may be republished in accordance with the Creative Commons Attribution-NonCommercial-NoDerivatives 4.0 International Public License, and in accordance with our Terms of Use.
The views expressed in this article are those of the author alone and not the World Economic Forum.
The Agenda Weekly
A weekly update of the most important issues driving the global agenda
You can unsubscribe at any time using the link in our emails. For more details, review our privacy policy.
More on Geographies in DepthSee all

Andrea Willige
April 23, 2024

Libby George
April 19, 2024

Apurv Chhavi
April 18, 2024

Efrem Garlando
April 16, 2024

Babajide Oluwase
April 15, 2024

Rida Tahir
April 9, 2024