Climate Crisis

Global warming: How much hotter is the earth today than when you were born?

These yearly global heat maps illustrate how much hotter the world is today than when you were born.

These yearly global heat maps illustrate how much hotter the world is today than when you were born. Image: Unsplash/Wolfgang Hasselmann

Spencer Feingold
Digital Editor, World Economic Forum
Share:
Our Impact
What's the World Economic Forum doing to accelerate action on Climate Crisis?
The Big Picture
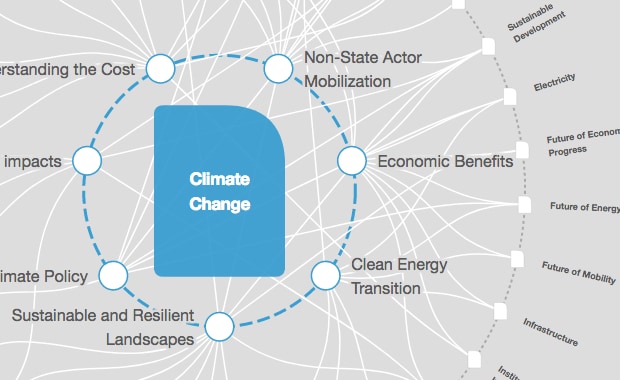
Explore and monitor how Climate Crisis is affecting economies, industries and global issues
A hand holding a looking glass by a lake
Crowdsource Innovation
Get involved with our crowdsourced digital platform to deliver impact at scale
Stay up to date:

Climate Crisis

Listen to the article

  • The rate of global warming has rapidly increased in recent decades.
  • Experts agree that climate change is exacerbating dangerously high temperatures across the world.
  • Yearly global heat maps—published by NASA, the US space agency—can illustrate how much hotter the world is today than when you were born.

Unrelenting heat waves across the world this week laid bare the grim realities of increasingly extreme temperatures.

Across Europe, thousands were evacuated as wildfires raged in soaring heat. In the United Kingdom, where thermostats rose above 40C for the first time in recorded history, major internet servers were knocked offline due to cooling system failures and planes had to be diverted from melting runways. Meanwhile, in North America, several US states recorded record daily temperatures, with multiple major cities declaring heat emergencies and opening cooling centers for the public.

Experts agree that global temperatures are rising at an unnervingly quick rate — and that the extreme heat we are witnessing today is exacerbated by climate change.

temperature anomaly rising global warming heat map
Global temperature anomaly (relative to 1951-1980) Image: NASA: Earth Observatory

Inflamed by the climate crisis, severe heat waves worldwide are increasingly imposing a major economic and human toll.

One study published in 2021 found that heat waves during four particularly hot years in the past two decades stunted economic growth in Europe by up to 2.5 times more than heat waves in other average years. Moreover, the World Health Organization estimates that over 166,000 people died from extreme heat between 1998 and 2017.

Understanding global warming through heat maps

To visualise the rapid rate of global warming, scroll through the heat maps below to examine temperature anomalies throughout the decades and see just how much the world's temperature has risen since the year you were born.

Years: 1930-1934

Heat map showing temperature anomaly for years: 1930-1934
Heat map showing temperature anomaly for years: 1930-1934 Image: NASA: Earth Observatory

Years: 1935-1939

Heat map showing temperature anomaly for years: 1935-1939
Heat map showing temperature anomaly for years: 1935-1939 Image: NASA: Earth Observatory

Years: 1940-1944

Heat map showing temperature anomaly for years: 1940-1944
Heat map showing temperature anomaly for years: 1940-1944 Image: NASA: Earth Observatory

Years: 1945-1949

Heat map showing temperature anomaly for years: 1945-1949
Heat map showing temperature anomaly for years: 1945-1949 Image: NASA: Earth Observatory

Years: 1950-1954

Heat map showing temperature anomaly for years: 1950-1954
Heat map showing temperature anomaly for years: 1950-1954 Image: NASA: Earth Observatory

Years: 1955-1959

Heat map showing temperature anomaly for years: 1955-1959
Heat map showing temperature anomaly for years: 1955-1959 Image: NASA: Earth Observatory

Years: 1960-1964

Heat map showing temperature anomaly for years: 1960-1964
Heat map showing temperature anomaly for years: 1960-1964 Image: NASA: Earth Observatory

Years: 1965-1969

Heat map showing temperature anomaly for years: 1965-1969
Heat map showing temperature anomaly for years: 1965-1969 Image: NASA: Earth Observatory

Years: 1970-1974

Heat map showing temperature anomaly for years: 1970-1974
Heat map showing temperature anomaly for years: 1970-1974 Image: NASA: Earth Observatory

Years: 1975-1979

Heat map showing temperature anomaly for years: 1975-1979
Heat map showing temperature anomaly for years: 1975-1979 Image: NASA: Earth Observatory

Years: 1980-1984

Heat map showing temperature anomaly for years: 1980-1984
Heat map showing temperature anomaly for years: 1980-1984 Image: NASA: Earth Observatory

Years: 1985-1989

Heat map showing temperature anomaly for years: 1985-1989
Heat map showing temperature anomaly for years: 1985-1989 Image: NASA: Earth Observatory

Years: 1990-1994

Heat map showing temperature anomaly for years: 1990-1994
Heat map showing temperature anomaly for years: 1990-1994 Image: NASA: Earth Observatory

Years: 1995-1999

Heat map showing temperature anomaly for years: 1995-1999
Heat map showing temperature anomaly for years: 1995-1999 Image: NASA: Earth Observatory

Years: 2000-2004

Heat map showing temperature anomaly for years: 2000-2004
Heat map showing temperature anomaly for years: 2000-2004 Image: NASA: Earth Observatory

Years: 2005-2009

Heat map showing temperature anomaly for years: 2005-2009
Heat map showing temperature anomaly for years: 2005-2009 Image: NASA: Earth Observatory

Years: 2010-2014

Heat map showing temperature anomaly for years: 2010-2014
Heat map showing temperature anomaly for years: 2010-2014 Image: NASA: Earth Observatory

Years: 2015-2019

Heat map showing temperature anomaly for years: 2015-2019
Heat map showing temperature anomaly for years: 2015-2019 Image: NASA: Earth Observatory

Year: 2021

Heat map showing temperature anomaly for the year 2021, compared to 1951-1980 average.
Heat map showing temperature anomaly for the year 2021, compared to 1951-1980 average. Image: NASA: Earth Observatory
Discover

How is the World Economic Forum fighting the climate crisis?

Loading...
Don't miss any update on this topic

Create a free account and access your personalized content collection with our latest publications and analyses.

Sign up for free

License and Republishing

World Economic Forum articles may be republished in accordance with the Creative Commons Attribution-NonCommercial-NoDerivatives 4.0 International Public License, and in accordance with our Terms of Use.

The views expressed in this article are those of the author alone and not the World Economic Forum.

Share:
World Economic Forum logo
Global Agenda

The Agenda Weekly

A weekly update of the most important issues driving the global agenda

Subscribe today

You can unsubscribe at any time using the link in our emails. For more details, review our privacy policy.

Reducing barriers to maritime fuel projects is key to decarbonizing shipping

Mette Asmussen and Takahiro Furusaki

April 18, 2024

About Us

Events

Media

Partners & Members

  • Join Us

Language Editions

Privacy Policy & Terms of Service

© 2024 World Economic Forum