Global Gender Gap Report 2026


Benchmarking gender gaps, 2026
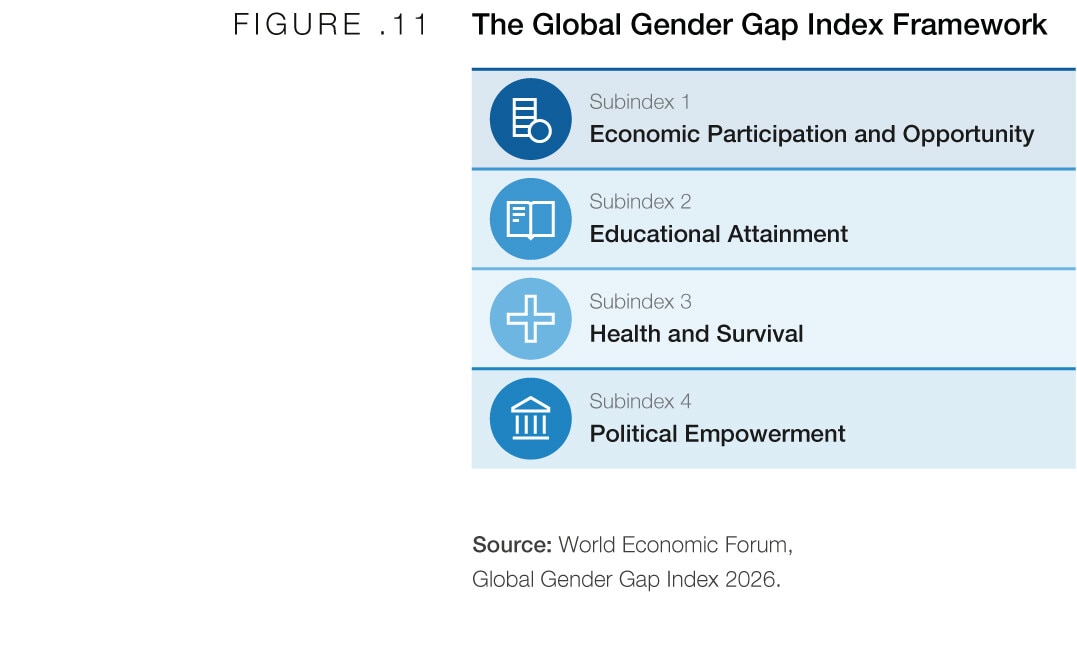
The Global Gender Gap Index was first introduced by the World Economic Forum in 2006 to benchmark progress towards gender parity across four dimensions: Economic Participation and Opportunity, Educational Attainment, Health and Survival and Political Empowerment. (Figure 1.1).

Throughout its 20 editions, the index has intended to offer a stable metric for the assessment of changes in gender parity indicators over time. Using the methodology introduced in 2006, the index and the analysis focus on benchmarking parity between women and men at global, regional and economy levels based on the latest available data.
The 20th edition of the report preserves the continuity and coherence of the index and its methodology to offer a twenty-year time series for analysis. For subsequent editions, the Forum continues to examine opportunities to expand and evolve the analysis of gender parity.
The level of progress toward gender parity (the parity score) for each indicator is calculated as the ratio of the value of each indicator for women to the value for men. A parity score of 1 indicates full parity and a score above 1 is truncated to 1 for interpretability. The gender gap is the distance from full parity. In addition to the 0–1 scale, the index also expresses progress toward gender parity as a percentage, indicating the extent to which the gender gap has been closed on a 0–100% scale. For further information on index methodology, please refer to Appendix B.
Economy coverage
To ensure a global representation of the gender gap, the report aims to cover as many economies as possible. For an economy to be included, it must report data for a minimum 12 of the 14 indicators that comprise the index. The index endeavours to include the latest data available, reported within the last 10 years.
Among the 145 economies included this year are a set of 97 economies that have been covered in all editions since 2006. In this edition, Malawi and Qatar re-enter the index. Due to data constraints, Ethiopia, Guinea, Nicaragua, Sudan and Uganda, covered in the last edition, could not be included in the latest edition. Data availability for over 50 economies that are not regularly included in the report remains a fundamental need and prerequisite for tracking and addressing gender gaps. Scores based on the constant set of economies are used to calculate and compare regional and global aggregates across time.
It should be noted that there may be time lags in the data collection and validation processes across the organizations from which the data is sourced, and that all results should be interpreted within a range of global, regional and national contextual factors. The Economy Profiles at the end of the report provide an additional broader range of data to support such analysis.
Global results
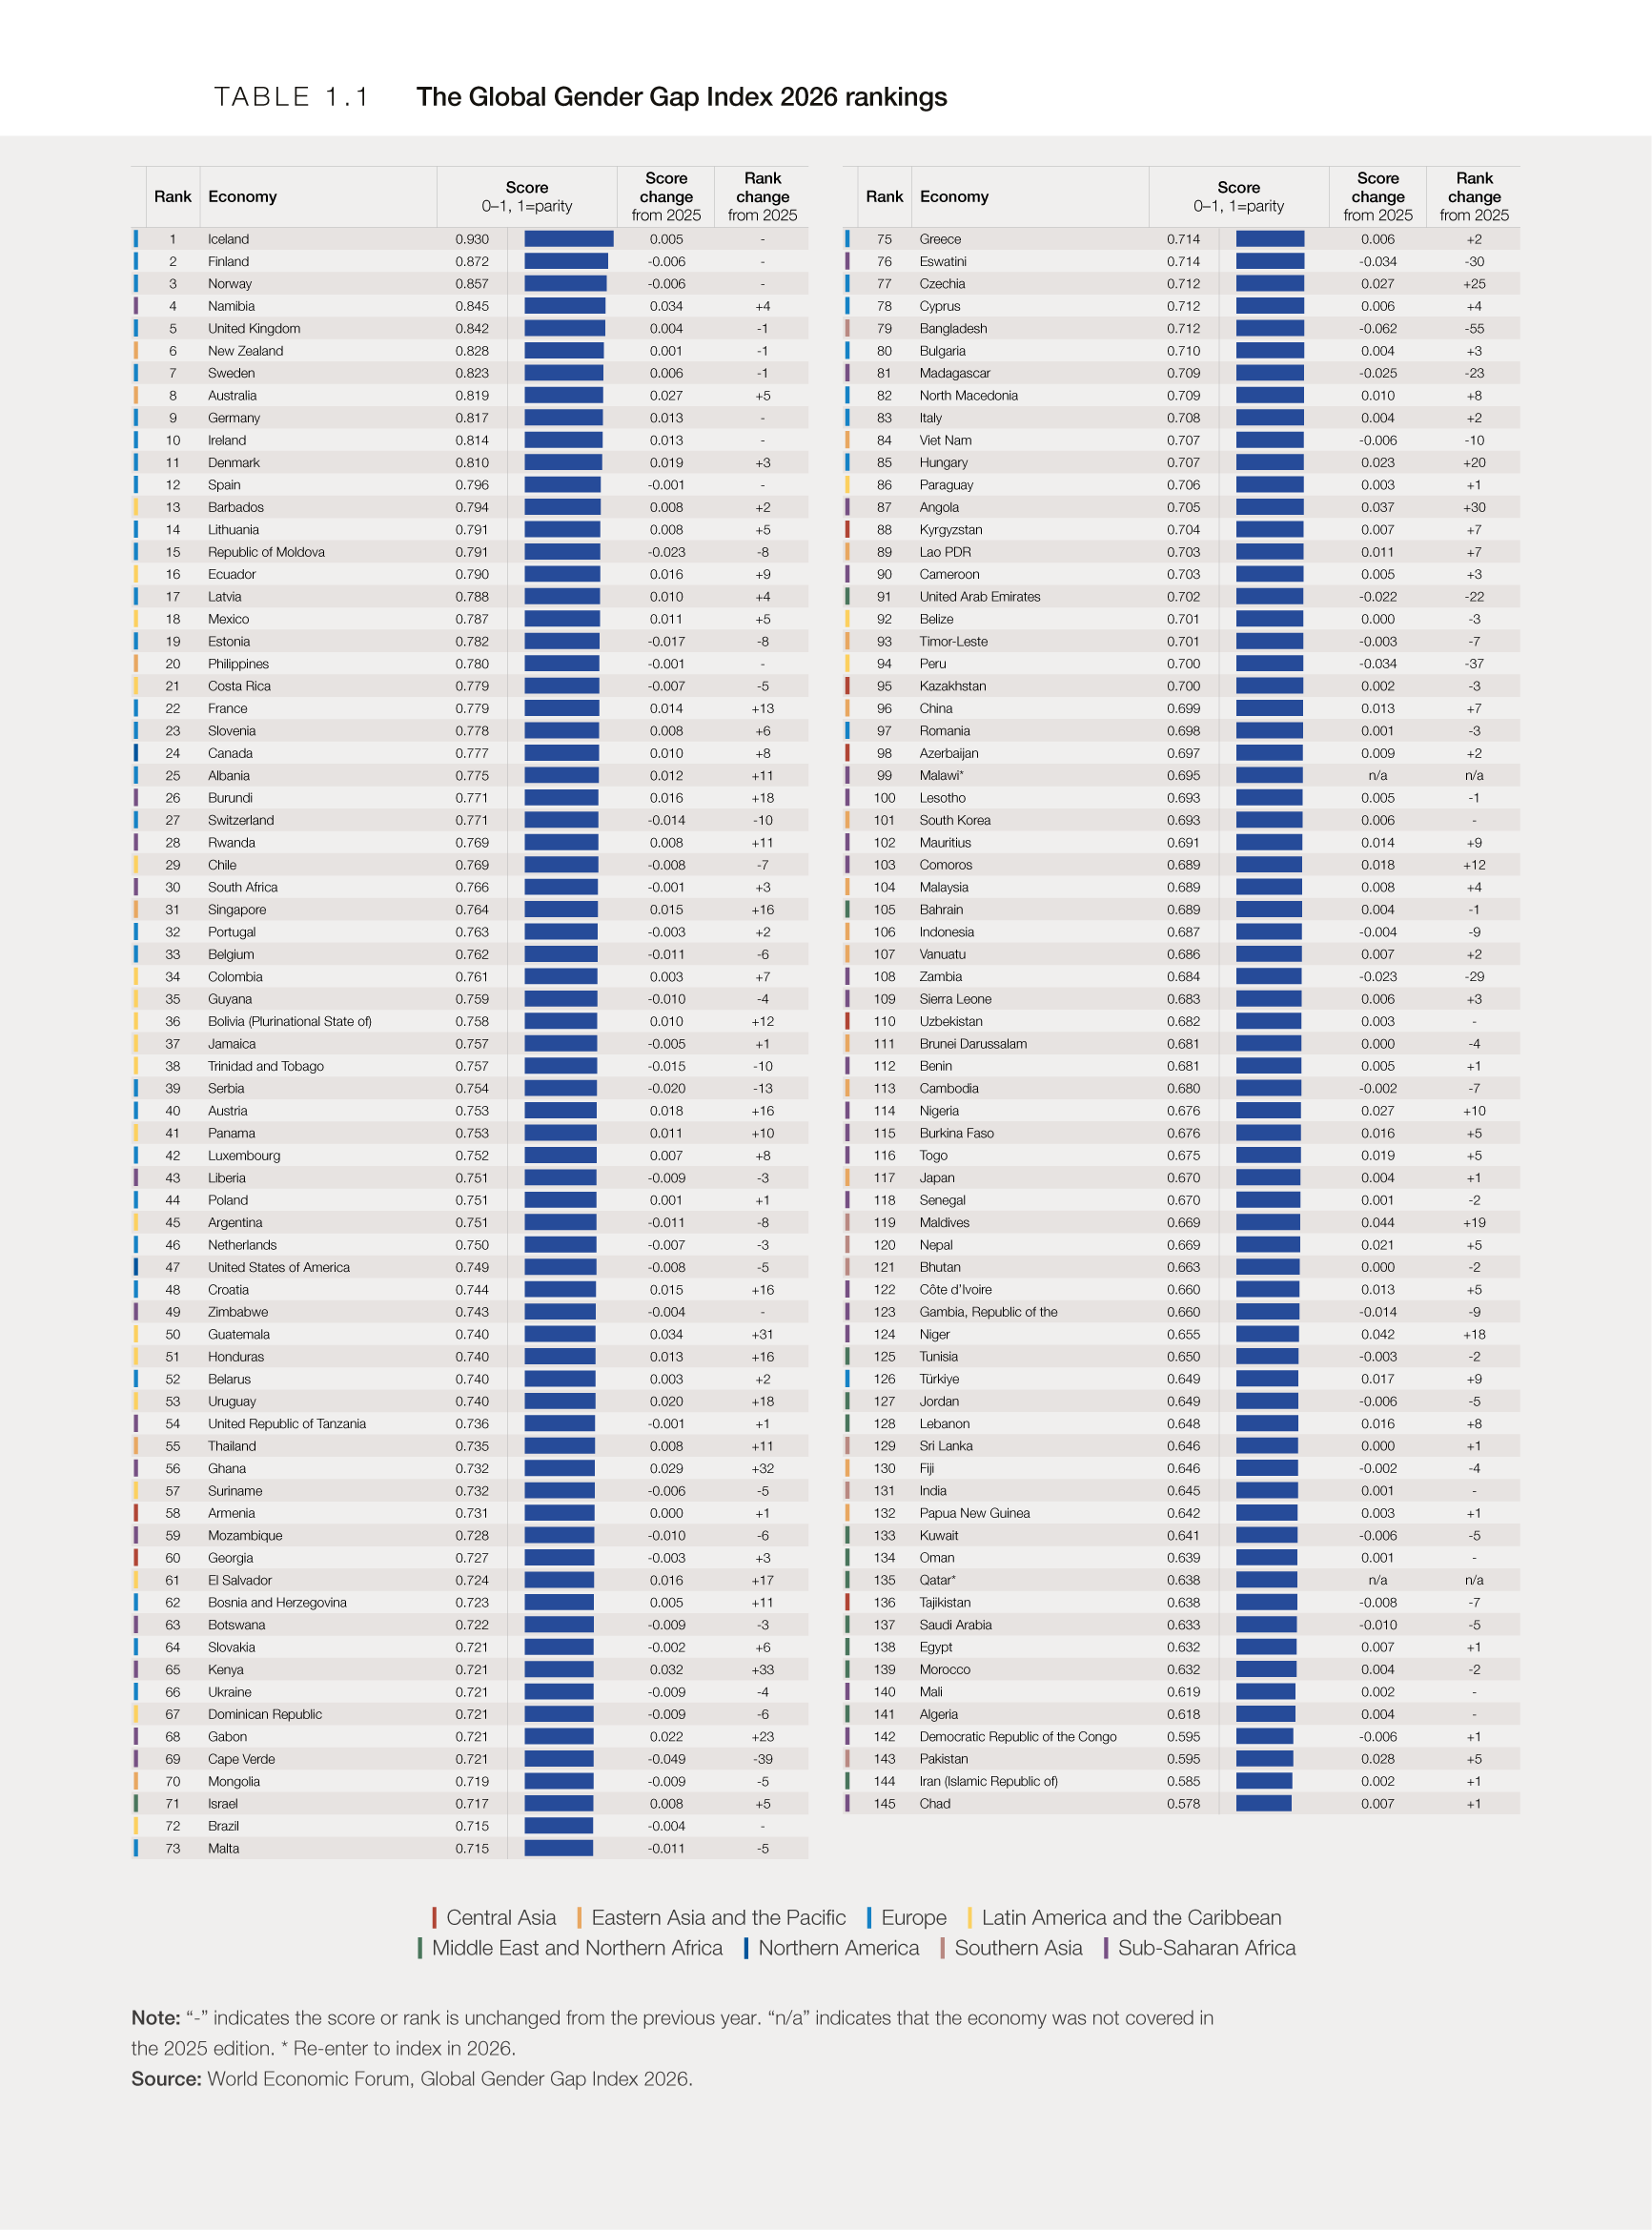
After 20 years of benchmarking progress, the global gender gap in 2026 is 69.2% closed for the 145 economies included in this edition. Compared to the results of the previous edition, the 2025 economic cohort of 143 economies that are included in the 2026 edition has seen the gender gap decrease by 0.4 percentage points. For the 97 economies that have been indexed across the report’s 20 editions, the global gender gap stands at 69.4% closed. Across time, this represents a +0.4 percentage-point improvement from the 2025 score of 68.9%, and a +5.2 percentage-point gain to as it was first measured in 2006, at 64.2%.
Of the 143 economies that are included in both this year and last year’s edition, approximately two-thirds have improved their gender parity scores. Among them, the five economies that reported the highest year-on-year score improvement are Maldives (+4.4 percentage points), Niger (+4.2 percentage points), Angola (+3.7 percentage points), Guatemala (+3.4 percentage points) and Namibia (+3.4 percentage points).
However, this edition also captures a downturn in performance for 36% of the 143 economies included in both the previous and current editions.
The gender gap score that an economy achieves reflects its own individual performance across the four dimensions measured by the index. In turn, an economy’s position in the ranking is indicative of where that effort stands in relation to other economies each year. In this edition, 78 economies improved their position by at least one rank. The economies that improved their relative position the most, compared to 2025, are Kenya (+33),
Ghana (+32), Guatemala (+31), Angola (+30) and Czechia (+25).
The top and bottom ranks of the index tend to record the least amount of variation, year on year.
Continuing the trend established in prior editions, this year’s top performers include seven European economies, one Sub-Saharan economy, and two from Eastern Asia and the Pacific (Figure 1.2). Iceland (93%, 1st) consolidates it 20th appearance in the top 10 with a 17-year long hold of the top rank. Maintaining its breakaway lead for another year, Iceland remains the sole economy to have closed over 90% of its gender gap. Alongside Iceland, Finland (87.2%, 2nd) and Norway (85.7%, 3rd) replicate the podium for the third year in a row. Climbing up four positions in the ranking, Namibia (84.5%, 4th) is the highest-scoring Sub-Saharan economy and joins the top 10 for the seventh year running, just one appearance short of its regional peer, Rwanda. The United Kingdom (84.2%, 5th) makes a return appearance in the top performer category, following Namibia closely in score, despite losing one rank since the last edition. Also displaced by one rank since 2025, both New Zealand (82.8%, 6th) and Sweden (82.3%, 7th) retain their top group status for the 19th and 20th year in a row, respectively. In contrast, Australia rises five places to make its top 10 debut with a score of 81.9%, placing 8th overall, and becoming the third economy from Eastern Asia and the Pacific to join the leaderboard in 20 years. Germany (81.7%, 9th) and Ireland (81.4%, 10th) complete the top 10 rankings with modest score increases since the last edition (+1.3 percentage point), but unchanged ranks. In 2026, The Republic of Moldova exits the top 10.
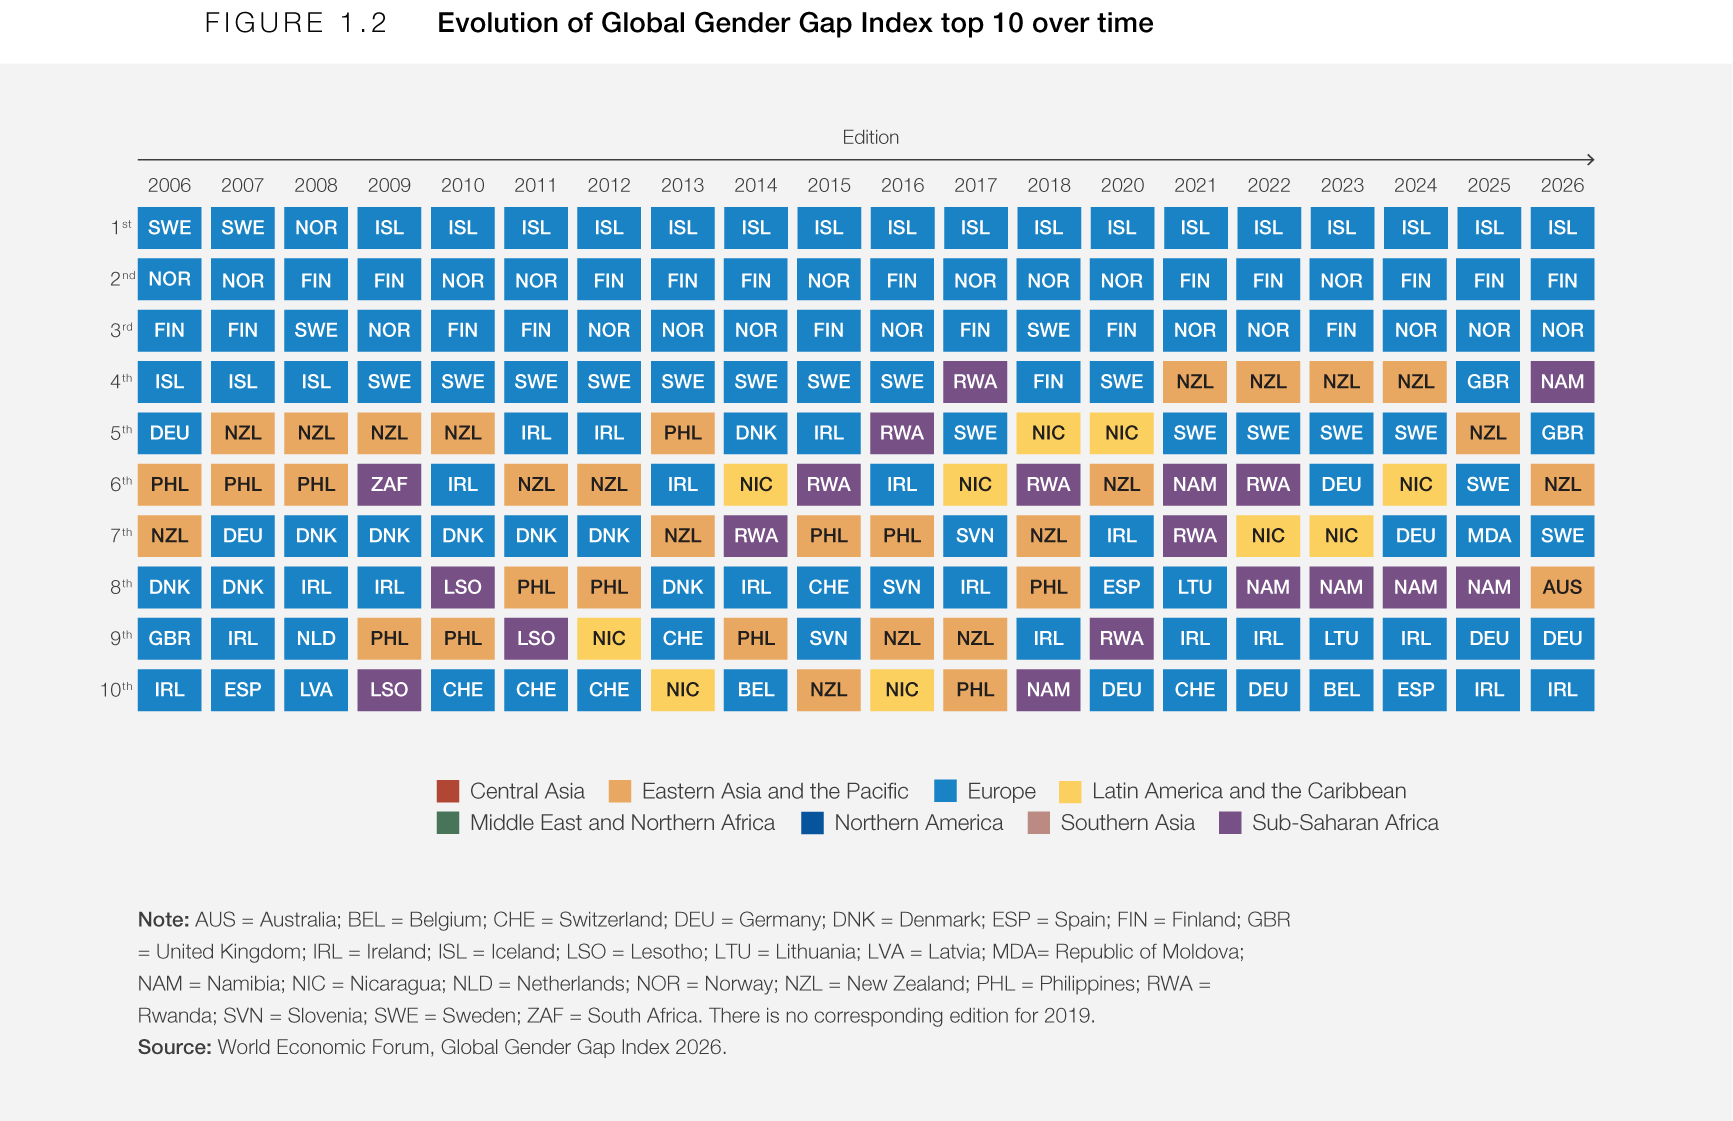

Across editions, only four economies have featured in every top 10: Iceland, Finland, Norway, and Sweden. In comparison, five economies have only been featured once: Australia, Latvia, Moldova, Netherlands, and South Africa.
Compared to last year’s edition, the lowest-ranked performers all see higher rankings on account of this year’s cohort being three economies smaller. Among the bottom five economies, only Democratic Republic of the Congo (59.5%, 142nd) had a lower gender gap score. Chad (57.8%, 145th), Iran (Islamic Republic of) (58.5%, 144th), Pakistan (59.5%, 143rd), Algeria (61.8%, 141st) and Mali (61.9%, 140th) all report slight score increases.

Performance by income level
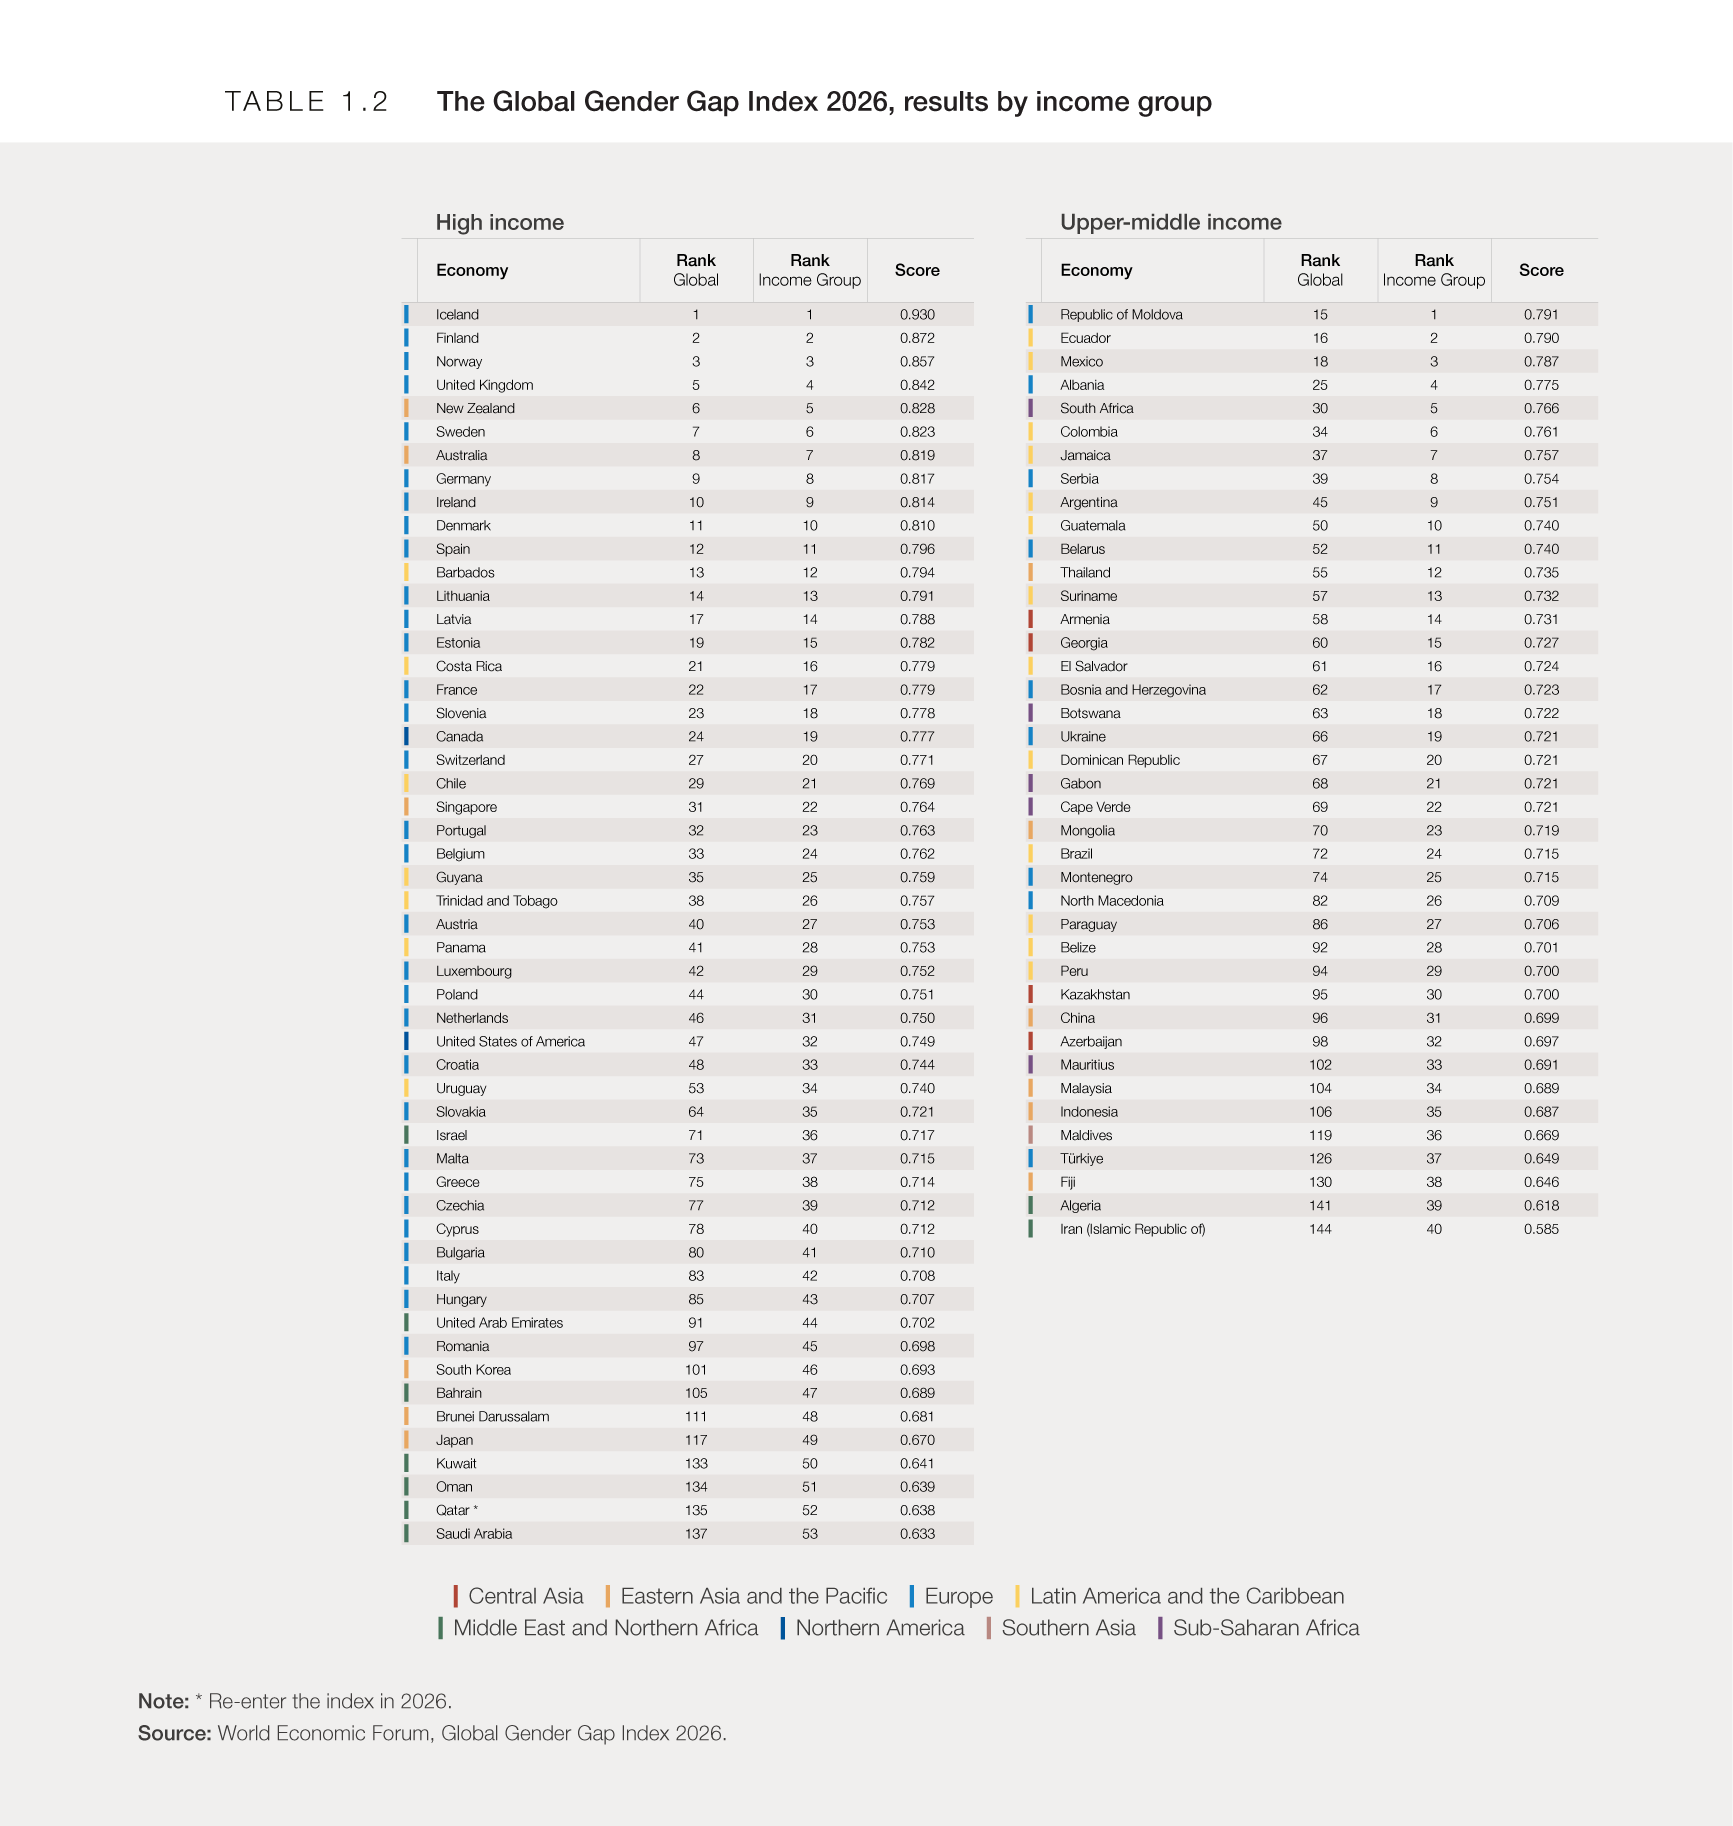
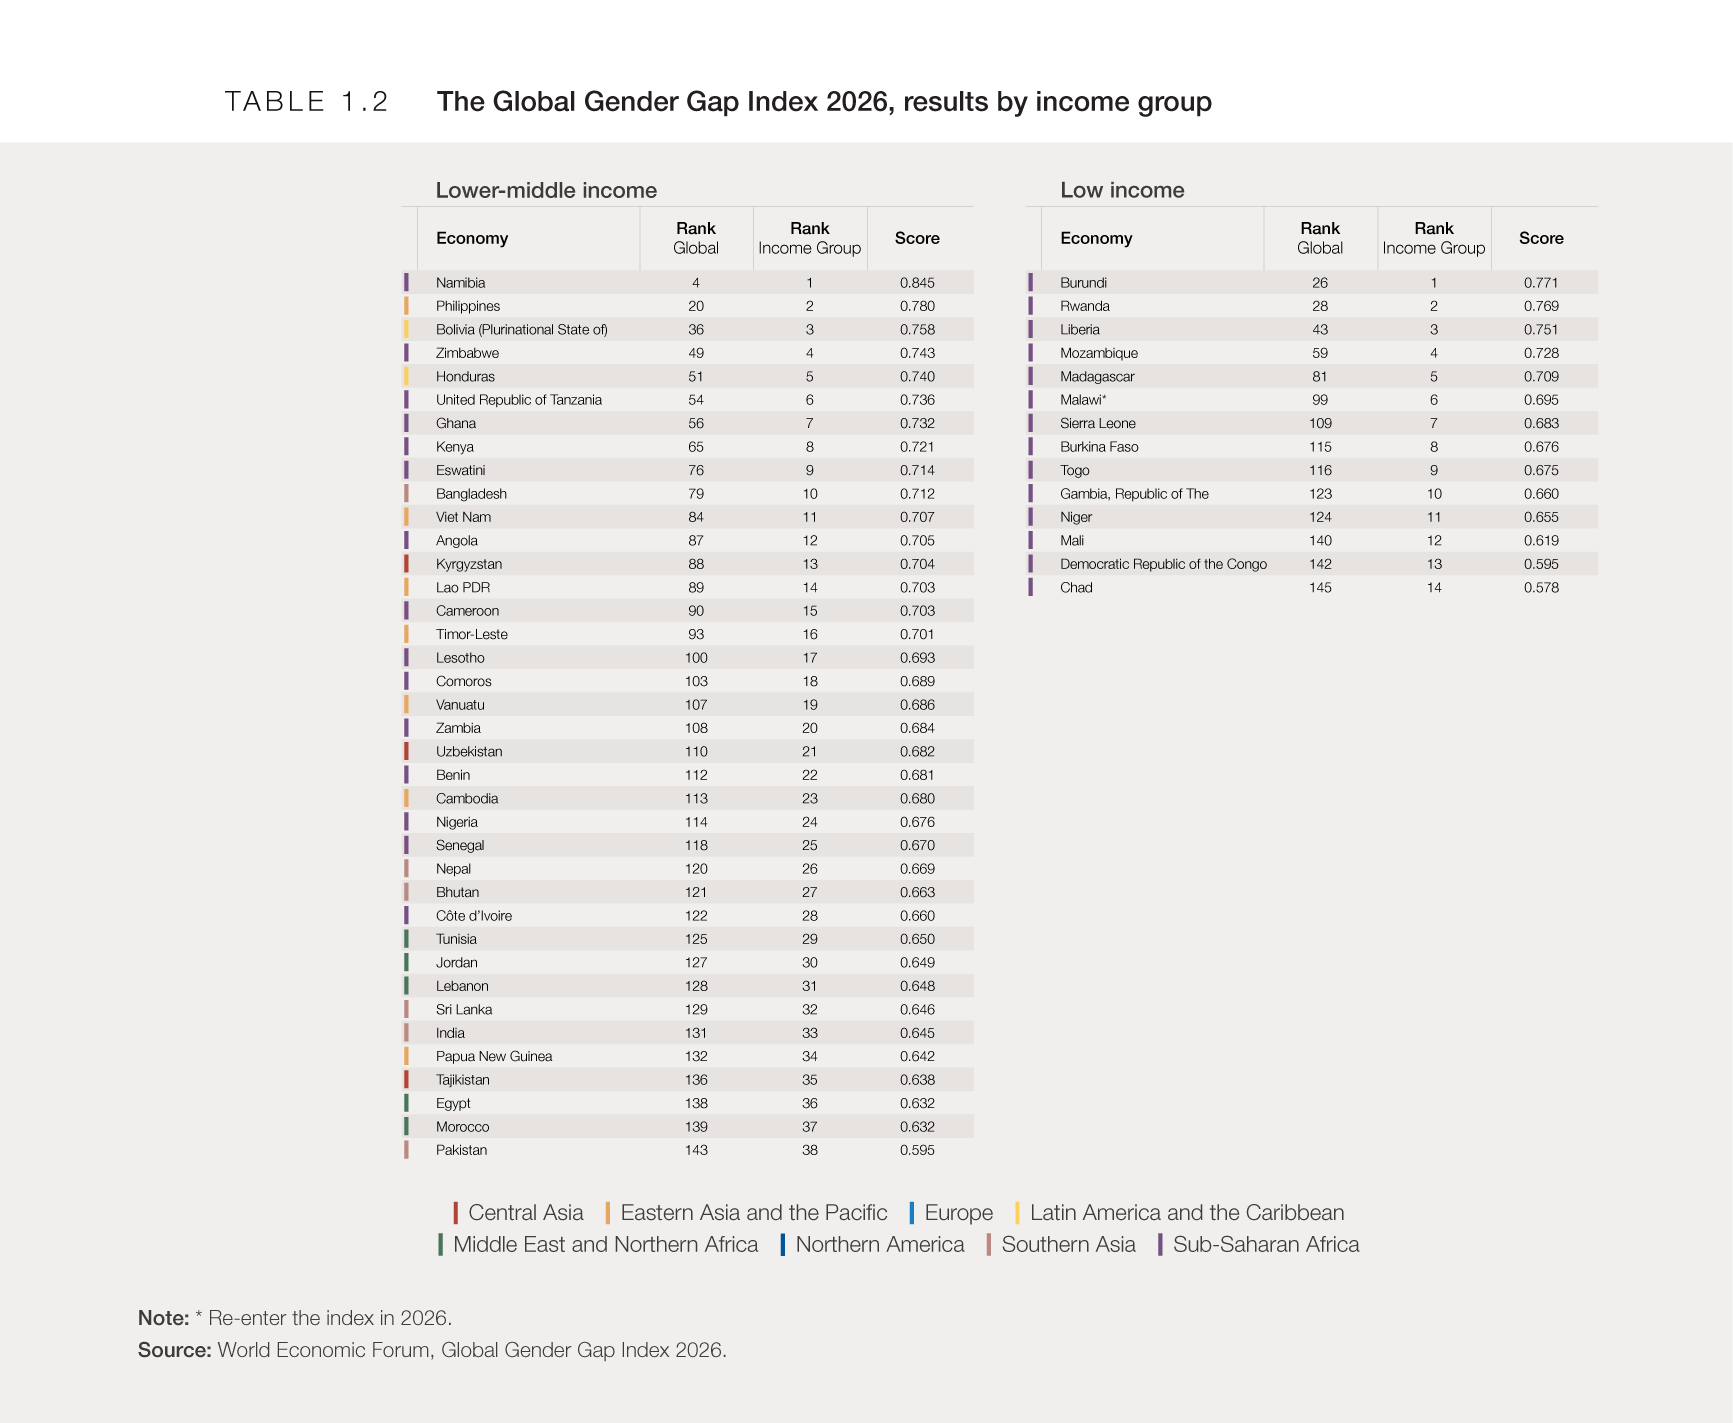
The income-group composition of this year’s index includes 53 high income economies, 40 upper-middle income economies, 38 lower-middle income economies and 14 low income economies. Approximately 78% of European economies are concentrated in the high income group, and the remaining in the upper-middle income group. In contrast, 85% of Sub-Saharan economies are part of the low income group. Nearly the entirety of Southern Asian economies are nested in the lower-middle income category. Latin American and the Caribbean economies are spread between high income (32%), upper-middle income (59%), and lower-middle income (9%) groups. Eastern Asia and the Pacific has nearly equal representation amongst the highest three income groups (32%, 32% and 37% from high, upper-middle, to lower-middle income).
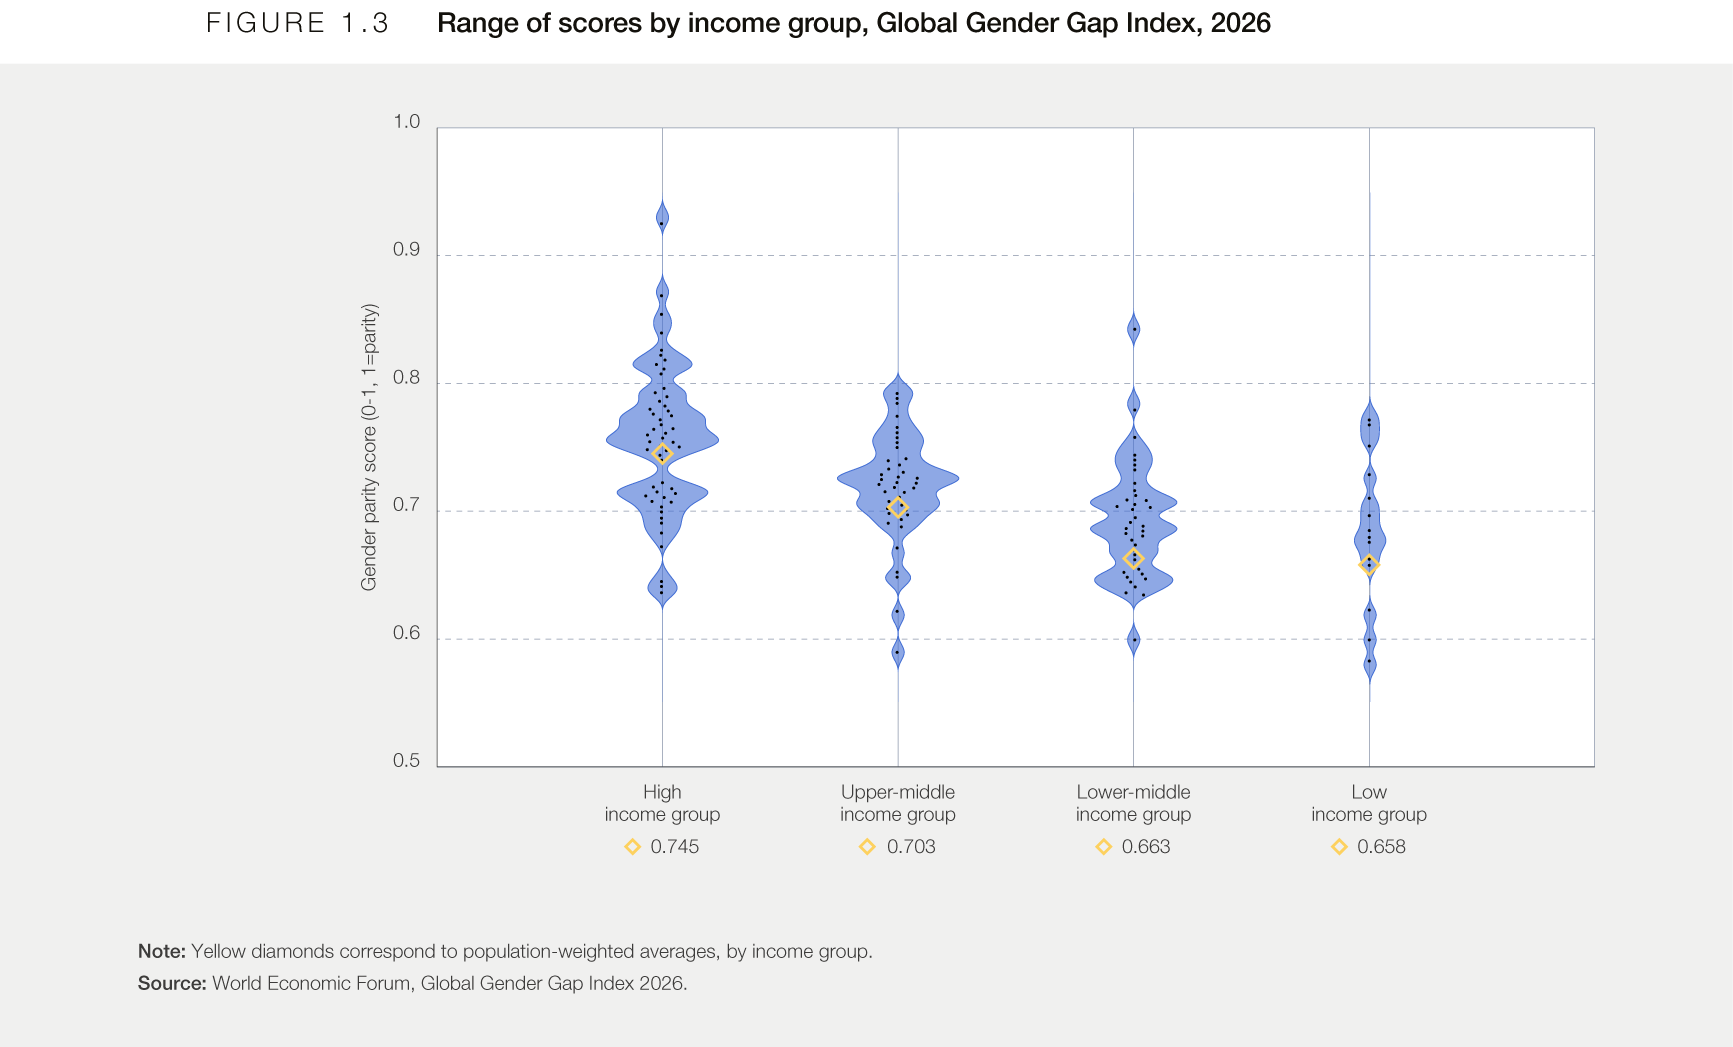
Once aggregated, the population-weighted average gender parity scores for each income group are all above 65%. High income economies have an average gender parity score of 74.5%, upper-middle income economies have a joint parity score of 70.3%, lower-middle income economies average 66.3% and low income economies average 65.8%. This pattern shows an initial positive relationship between income level and gender parity at the aggregate level.
At the same time, each income group shows substantial variation in scores (Figure 1.3). Although high-income economies account for nine of the top 10 positions in the global ranking, the parity scores of the remaining high income economies overlap considerably with those of upper-middle, lower middle, and low income economies.
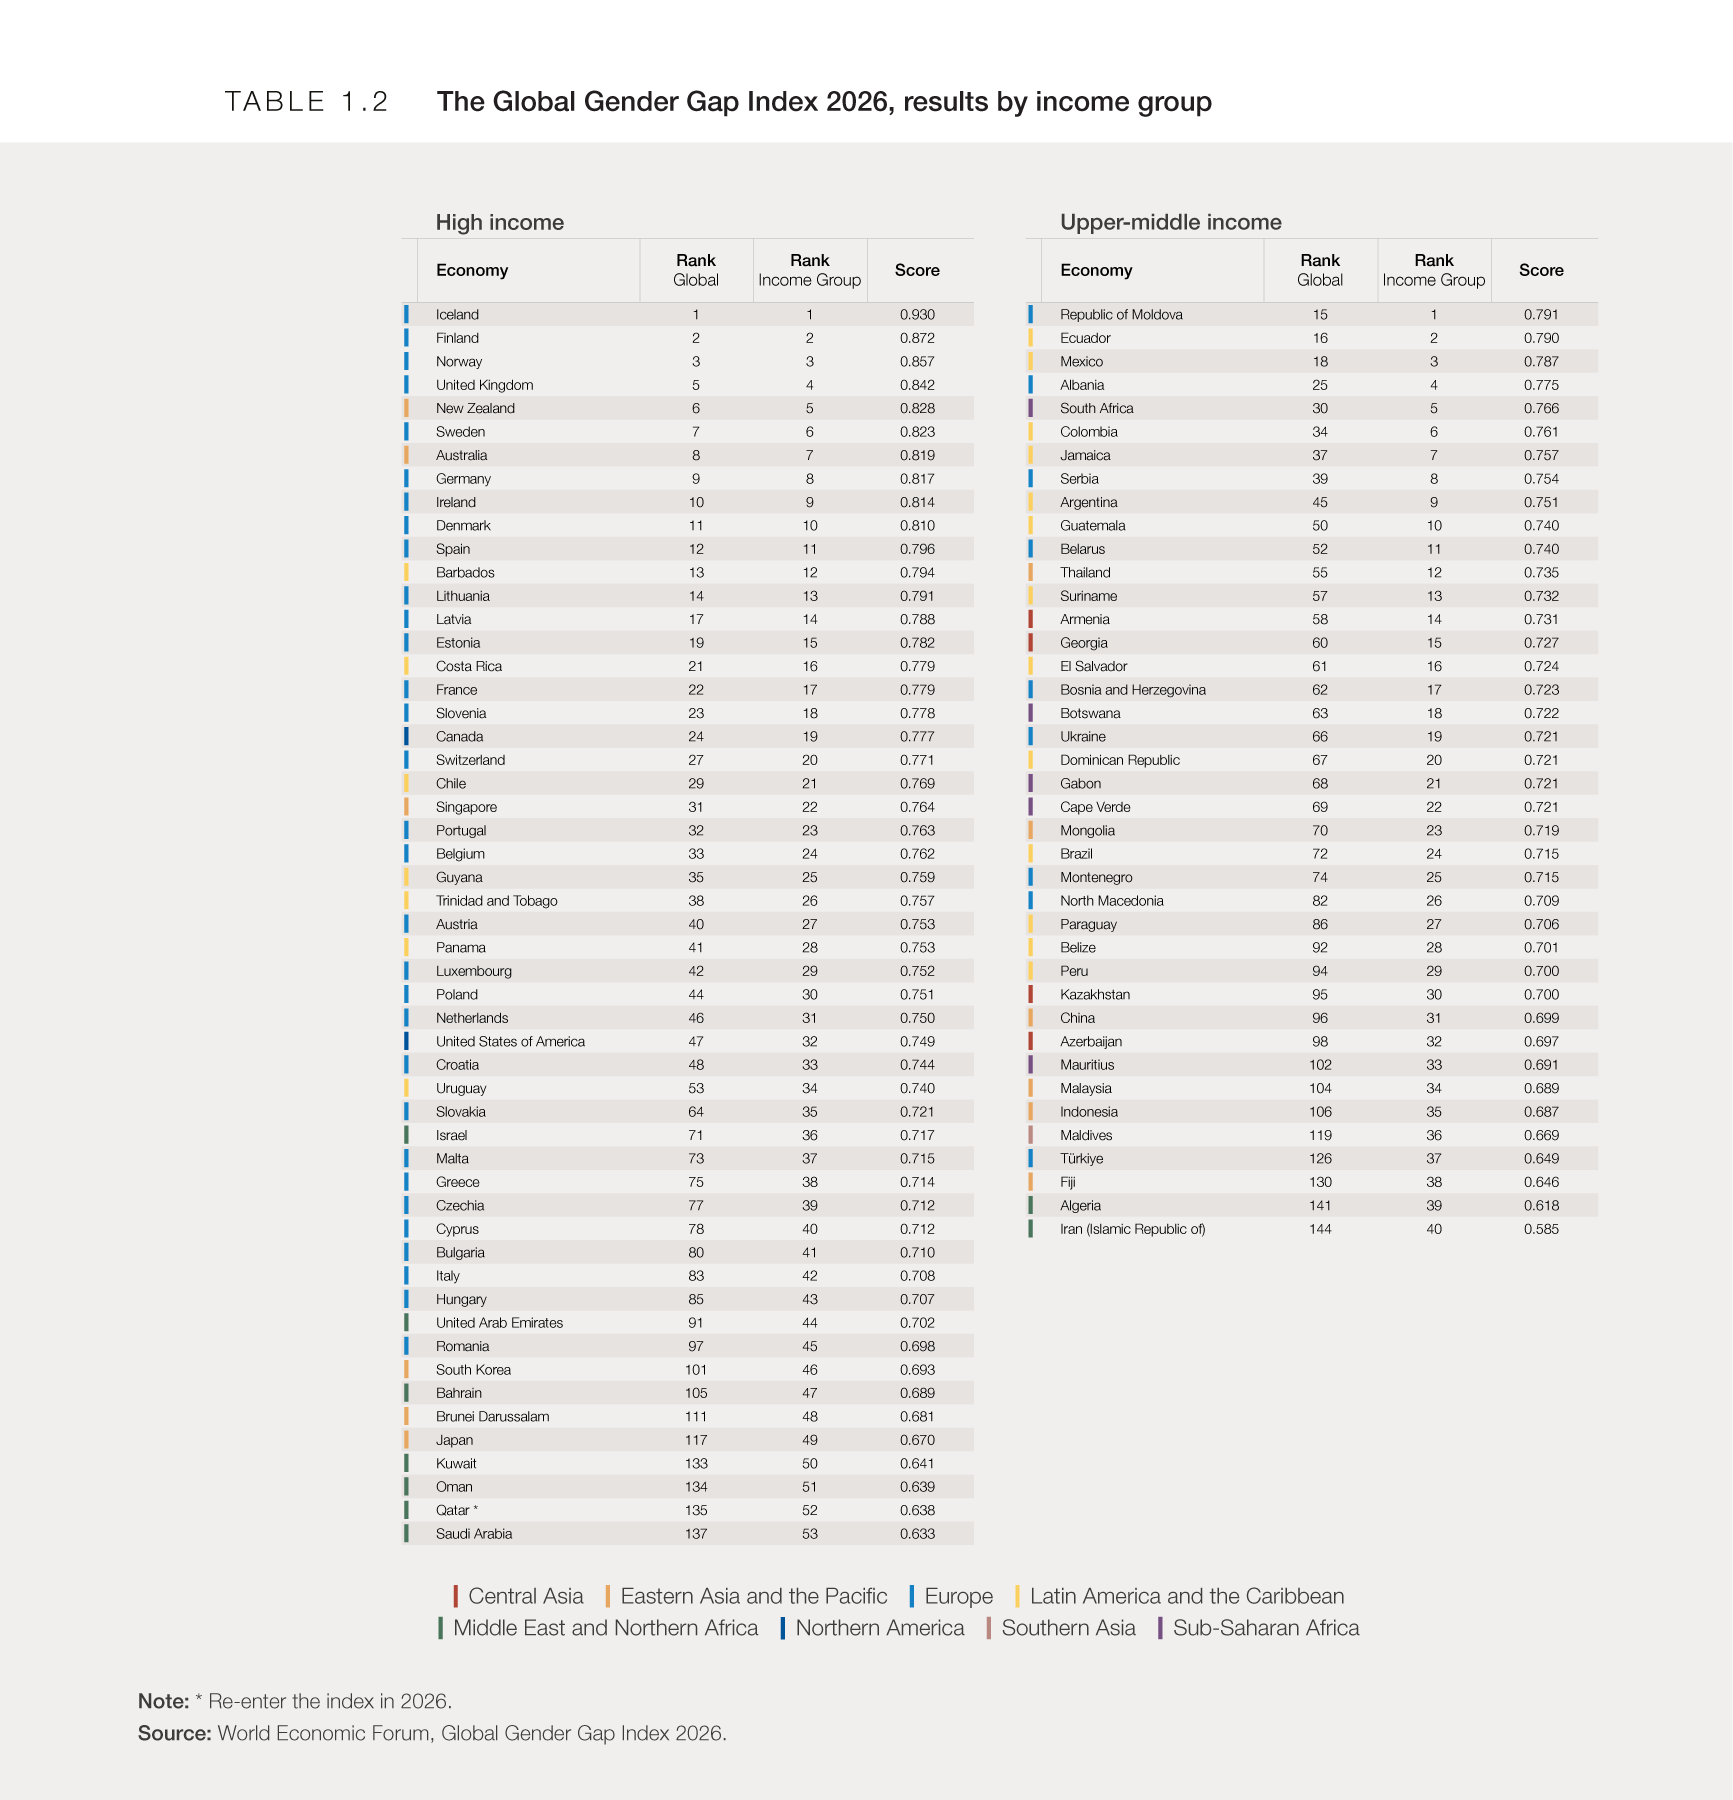
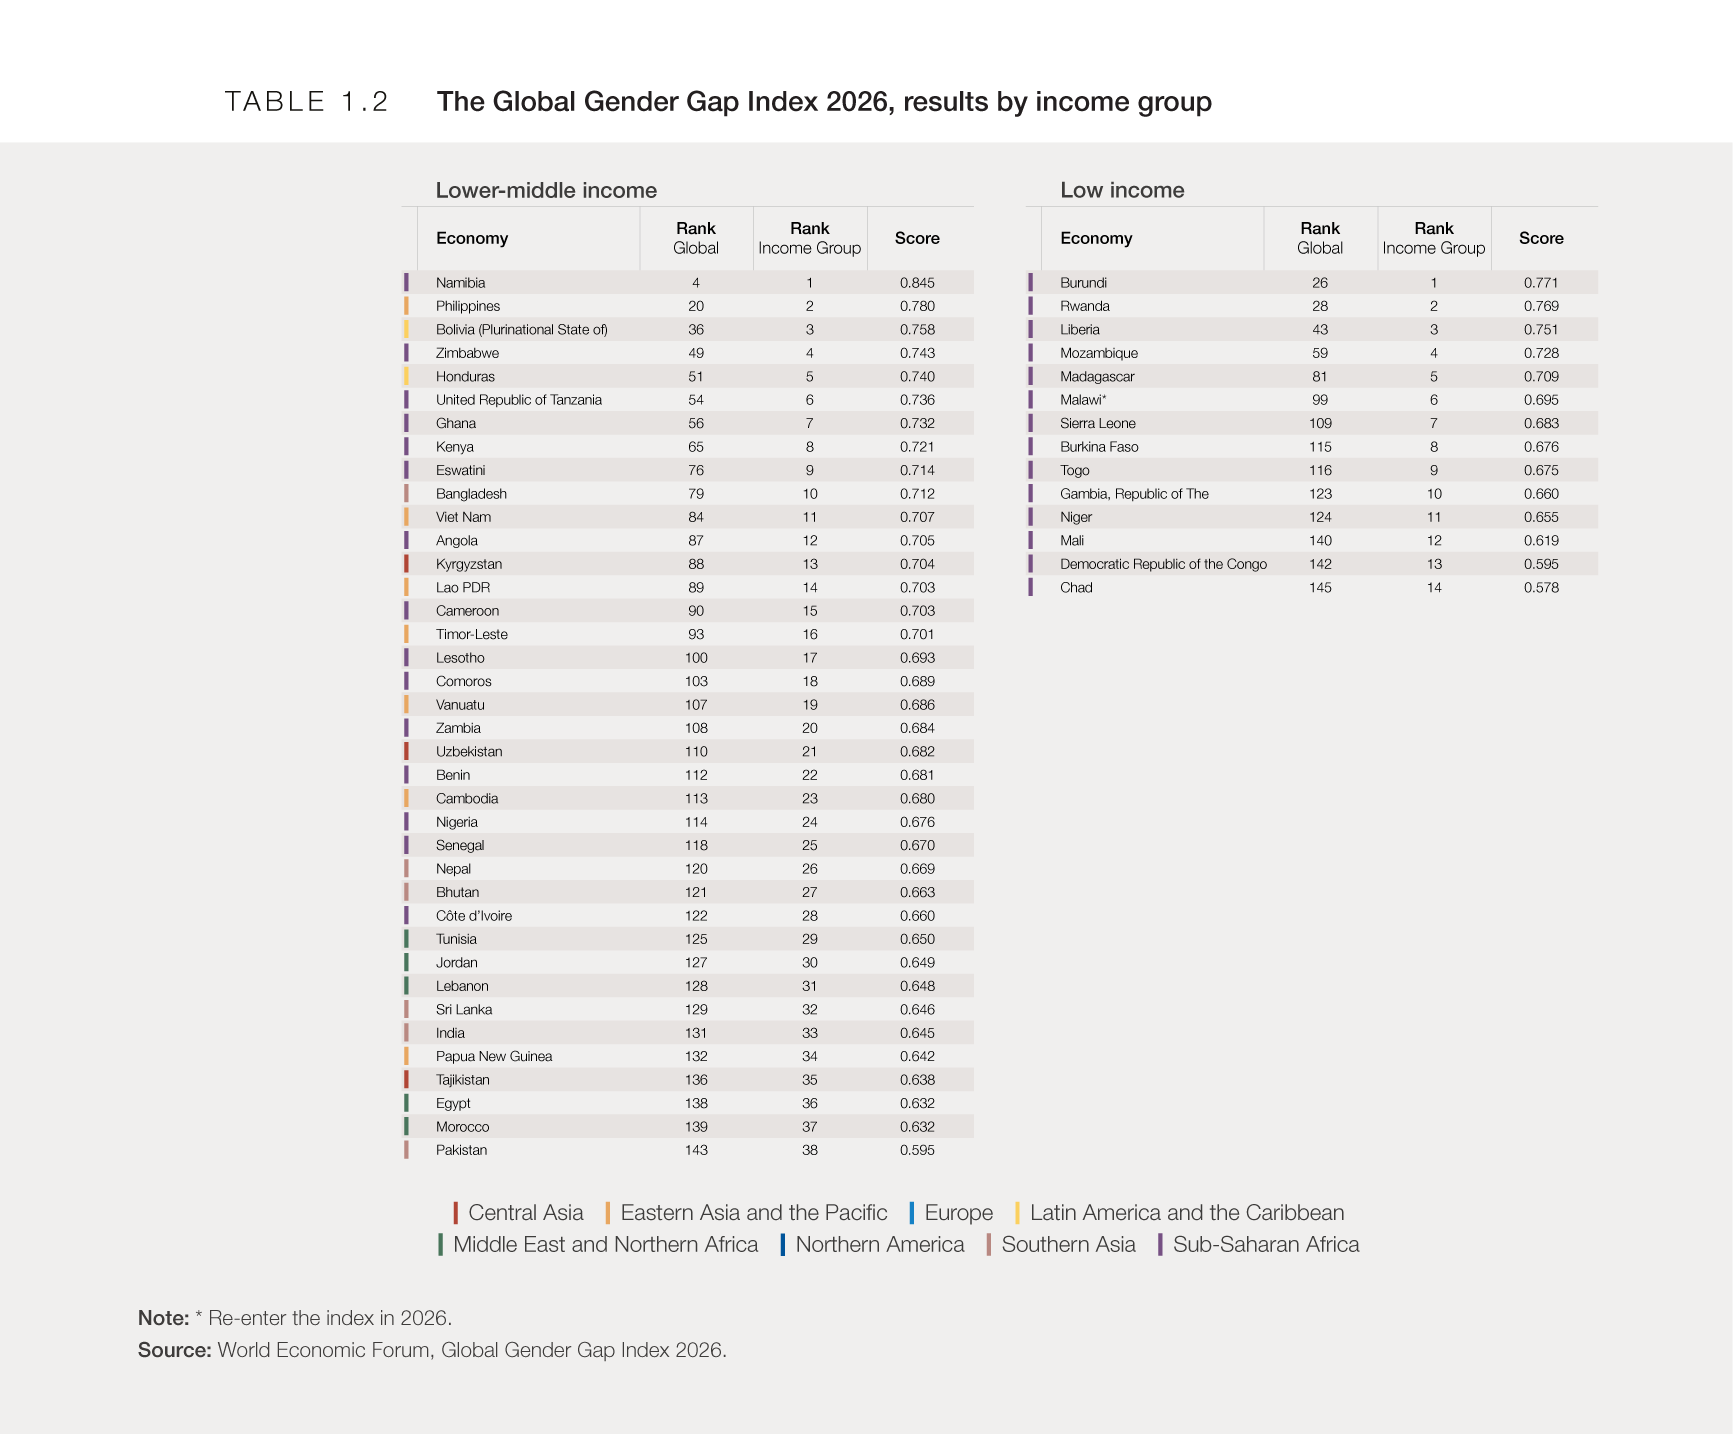
Several economies from lower-income groups also outperform a large share of higher-income peers. The Republic of Moldova, the highest-ranked upper-middle income economy with a parity score of 79.1%, scores higher than three quarters of high income economies. Namibia, the top-ranked lower-middle income economy, with a score of 84.5%, outperforms nearly all upper-middle income economies and 95% of high income economies. Burundi, the leading low income economy, with a score of 77.1%, outperforms 90% of both upper-middle and lower-middle income economies, as well as 65% of high income economies.
Individual performances within each income group are presented in Table 1.2.



Performance by subindex
This section presents the state of gender gaps across the four main components (subindexes) of the index: Economic Participation and Opportunity, Educational Attainment, Health and Survival, and Political Empowerment. In addition to presenting the aggregate subindex performance of the 145 economies included in the 2026 index, the analysis offers insights into variations across economies and the different indicators driving the overall average global gender gap score.
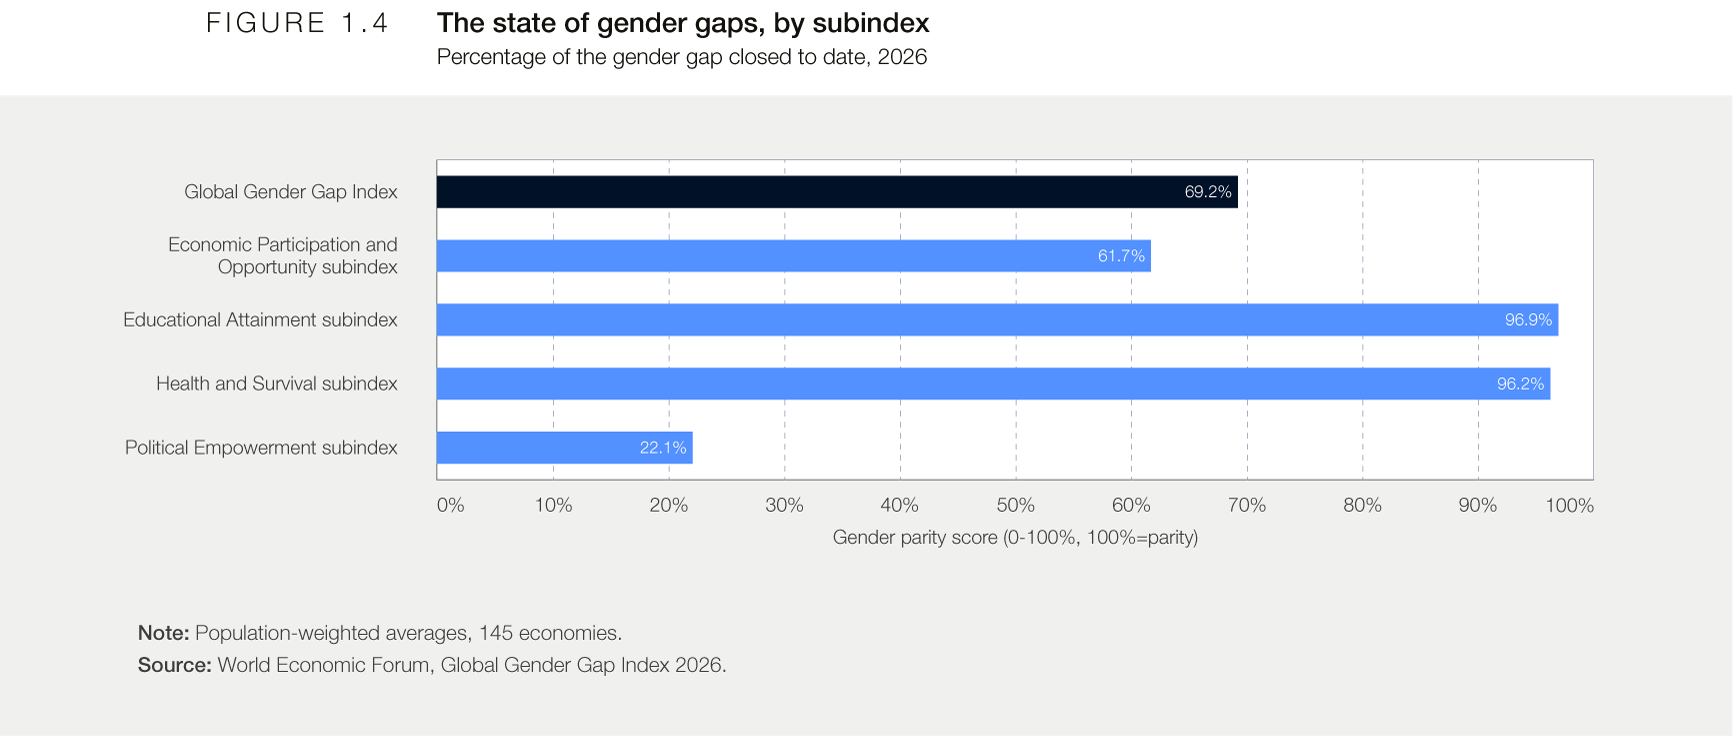
Figure 1.4 illustrates variations across the four subindexes. As of the 2026 edition, the global gender gap has closed by over 90% in both Health and Survival (96.9%) and Educational Attainment (96.2%). In contrast, gaps remain wider in Economic Participation and Opportunity, where 61.7% has been closed, and in Political Empowerment, which has achieved 22.1% closure globally.

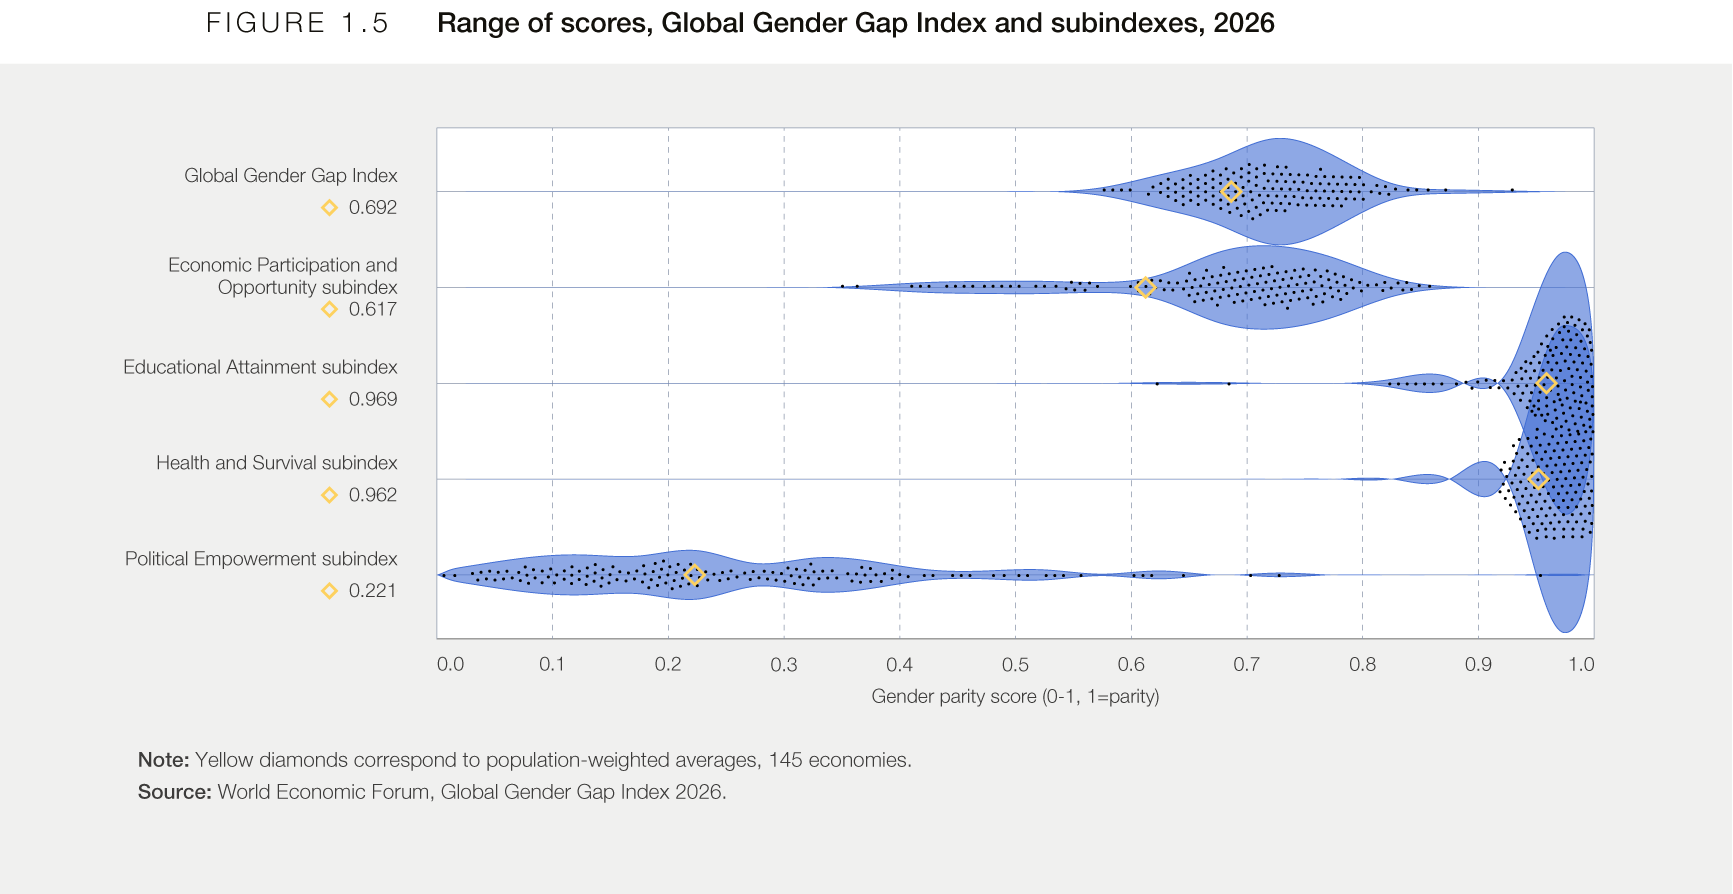
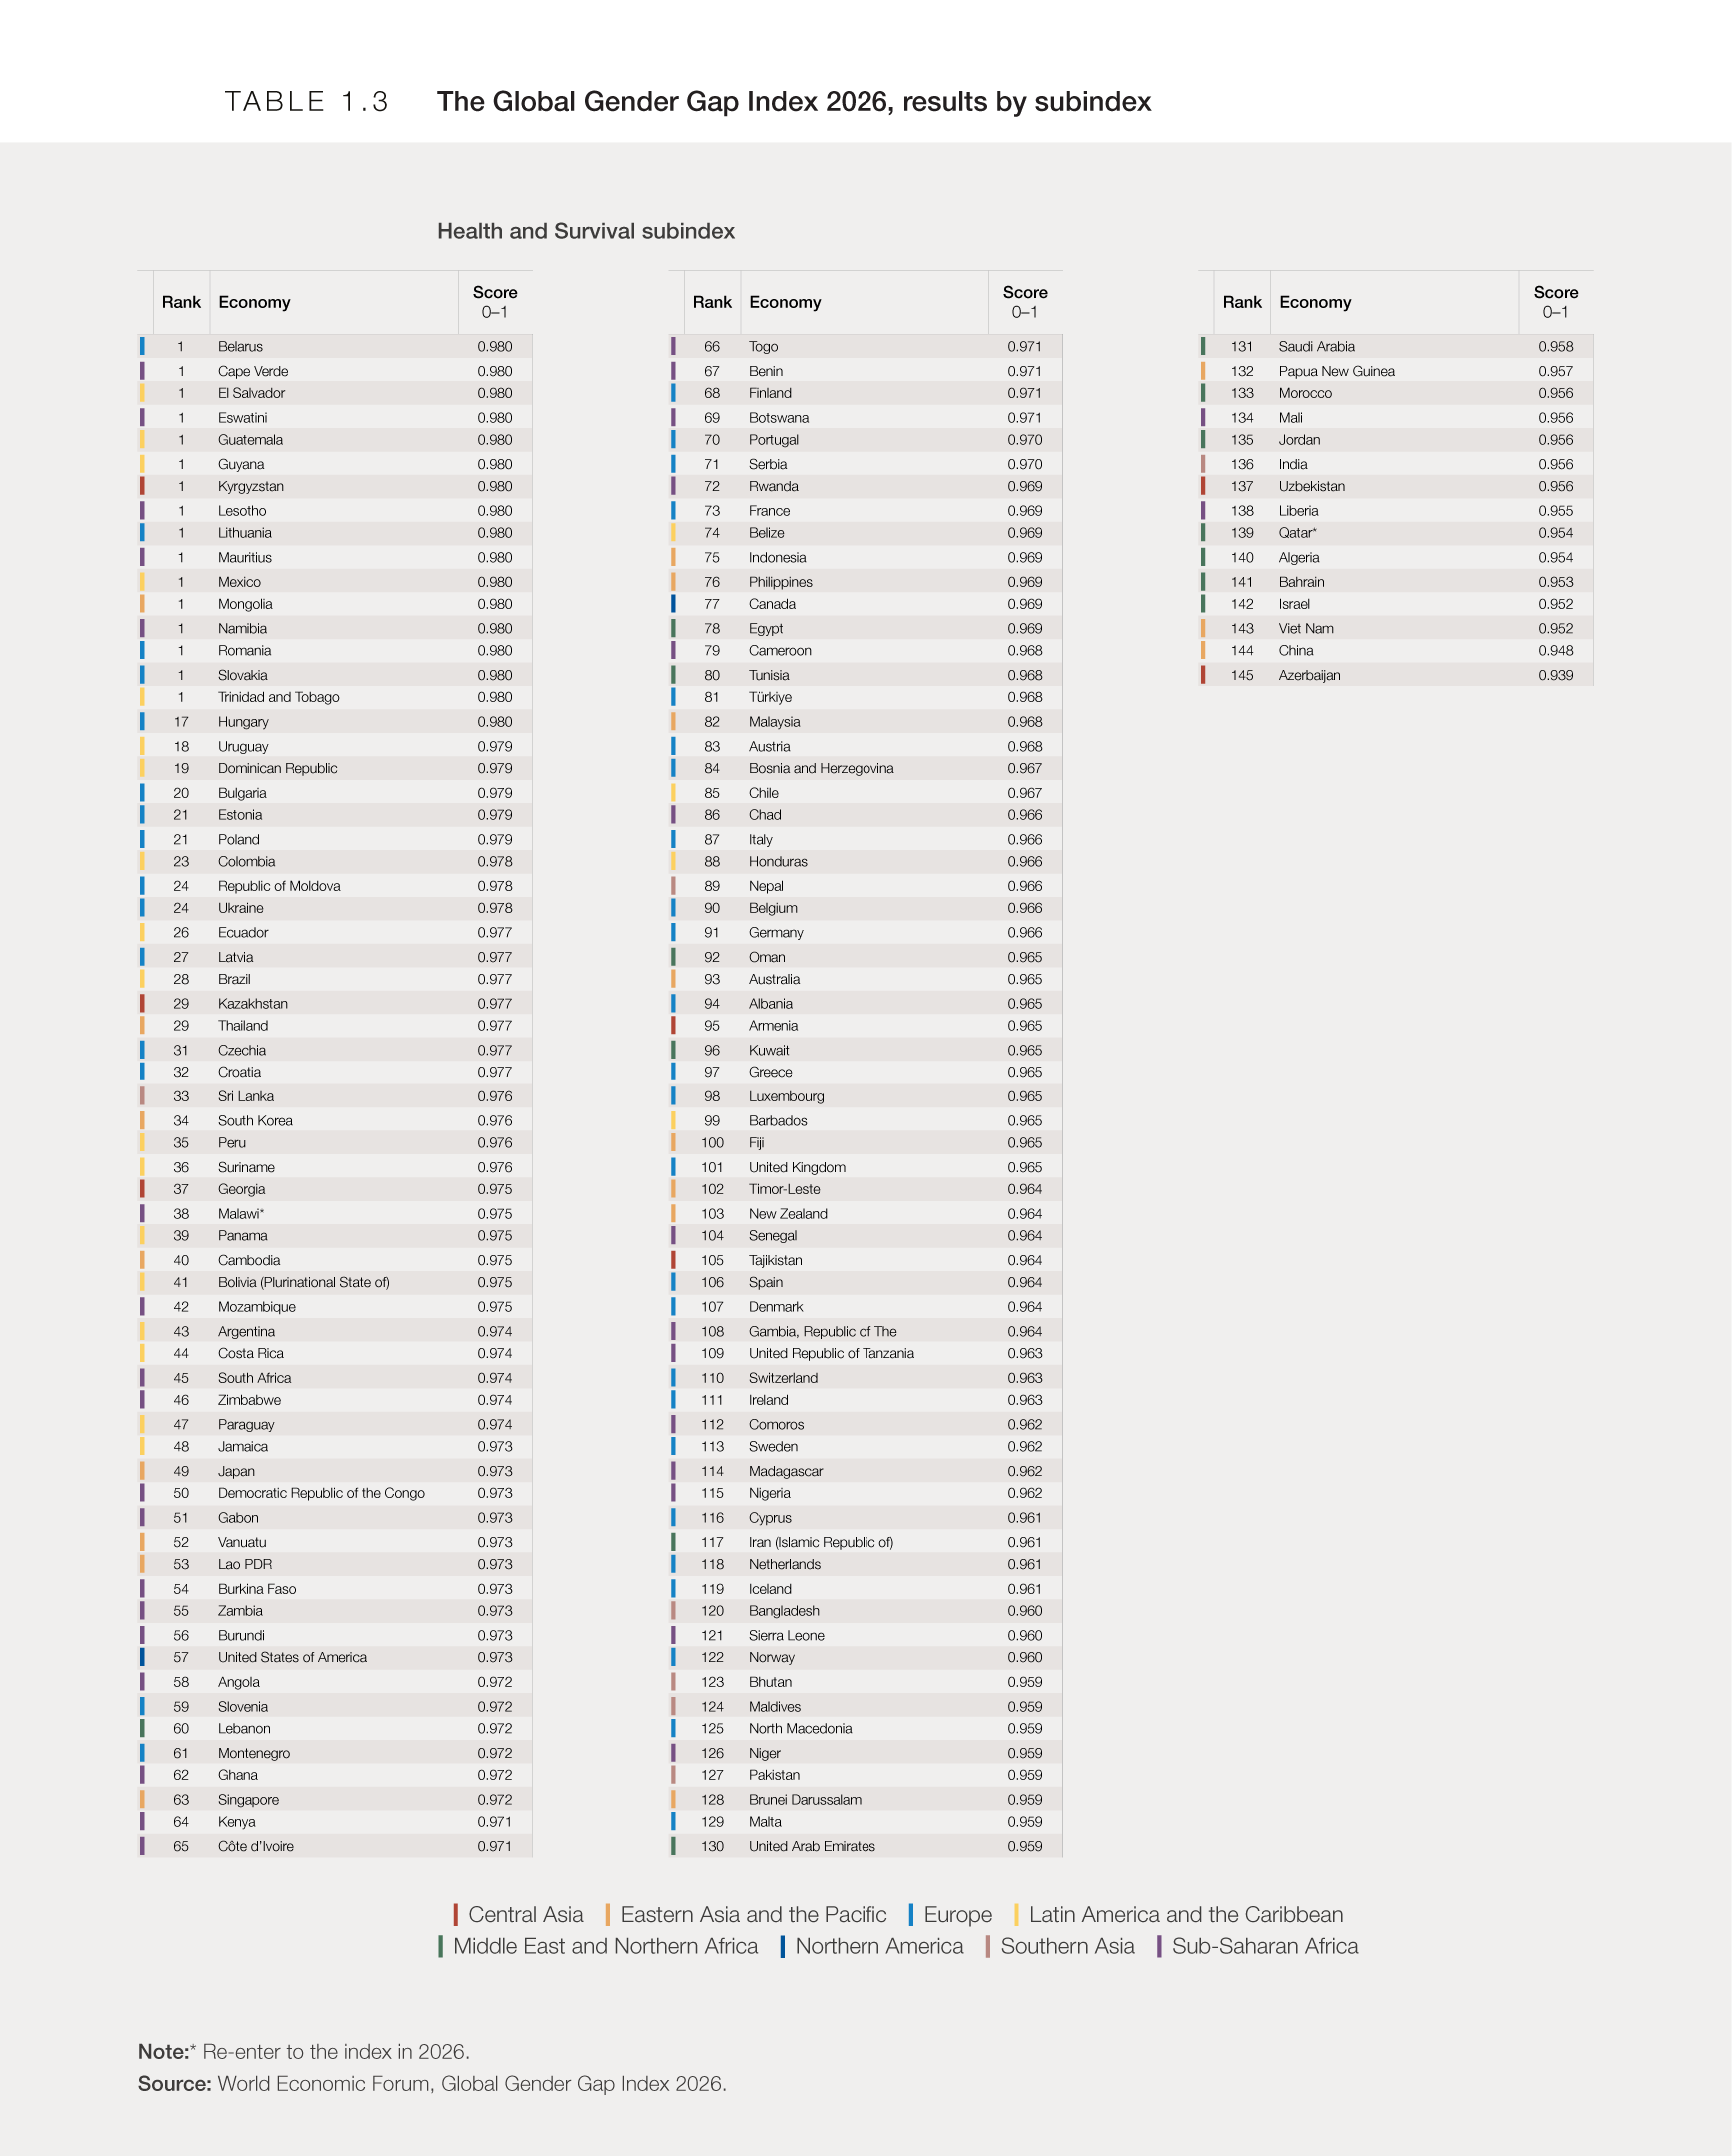
Subindexes that are closer to gender parity also tend to exhibit less variation across economies. As illustrated in Figure 1.5, Health and Survival shows relatively narrow distributions of scores at the economy level. All 145 economies covered in the 2026 edition have closed more than 90% of their gender gap in this subindex; 16 economies have achieved full parity (98%), while Azerbaijan (93.9%) and China (94.8%) are the two economies with scores below 95%, though both remain close to parity (Figure 1.5 and Table 1.3).
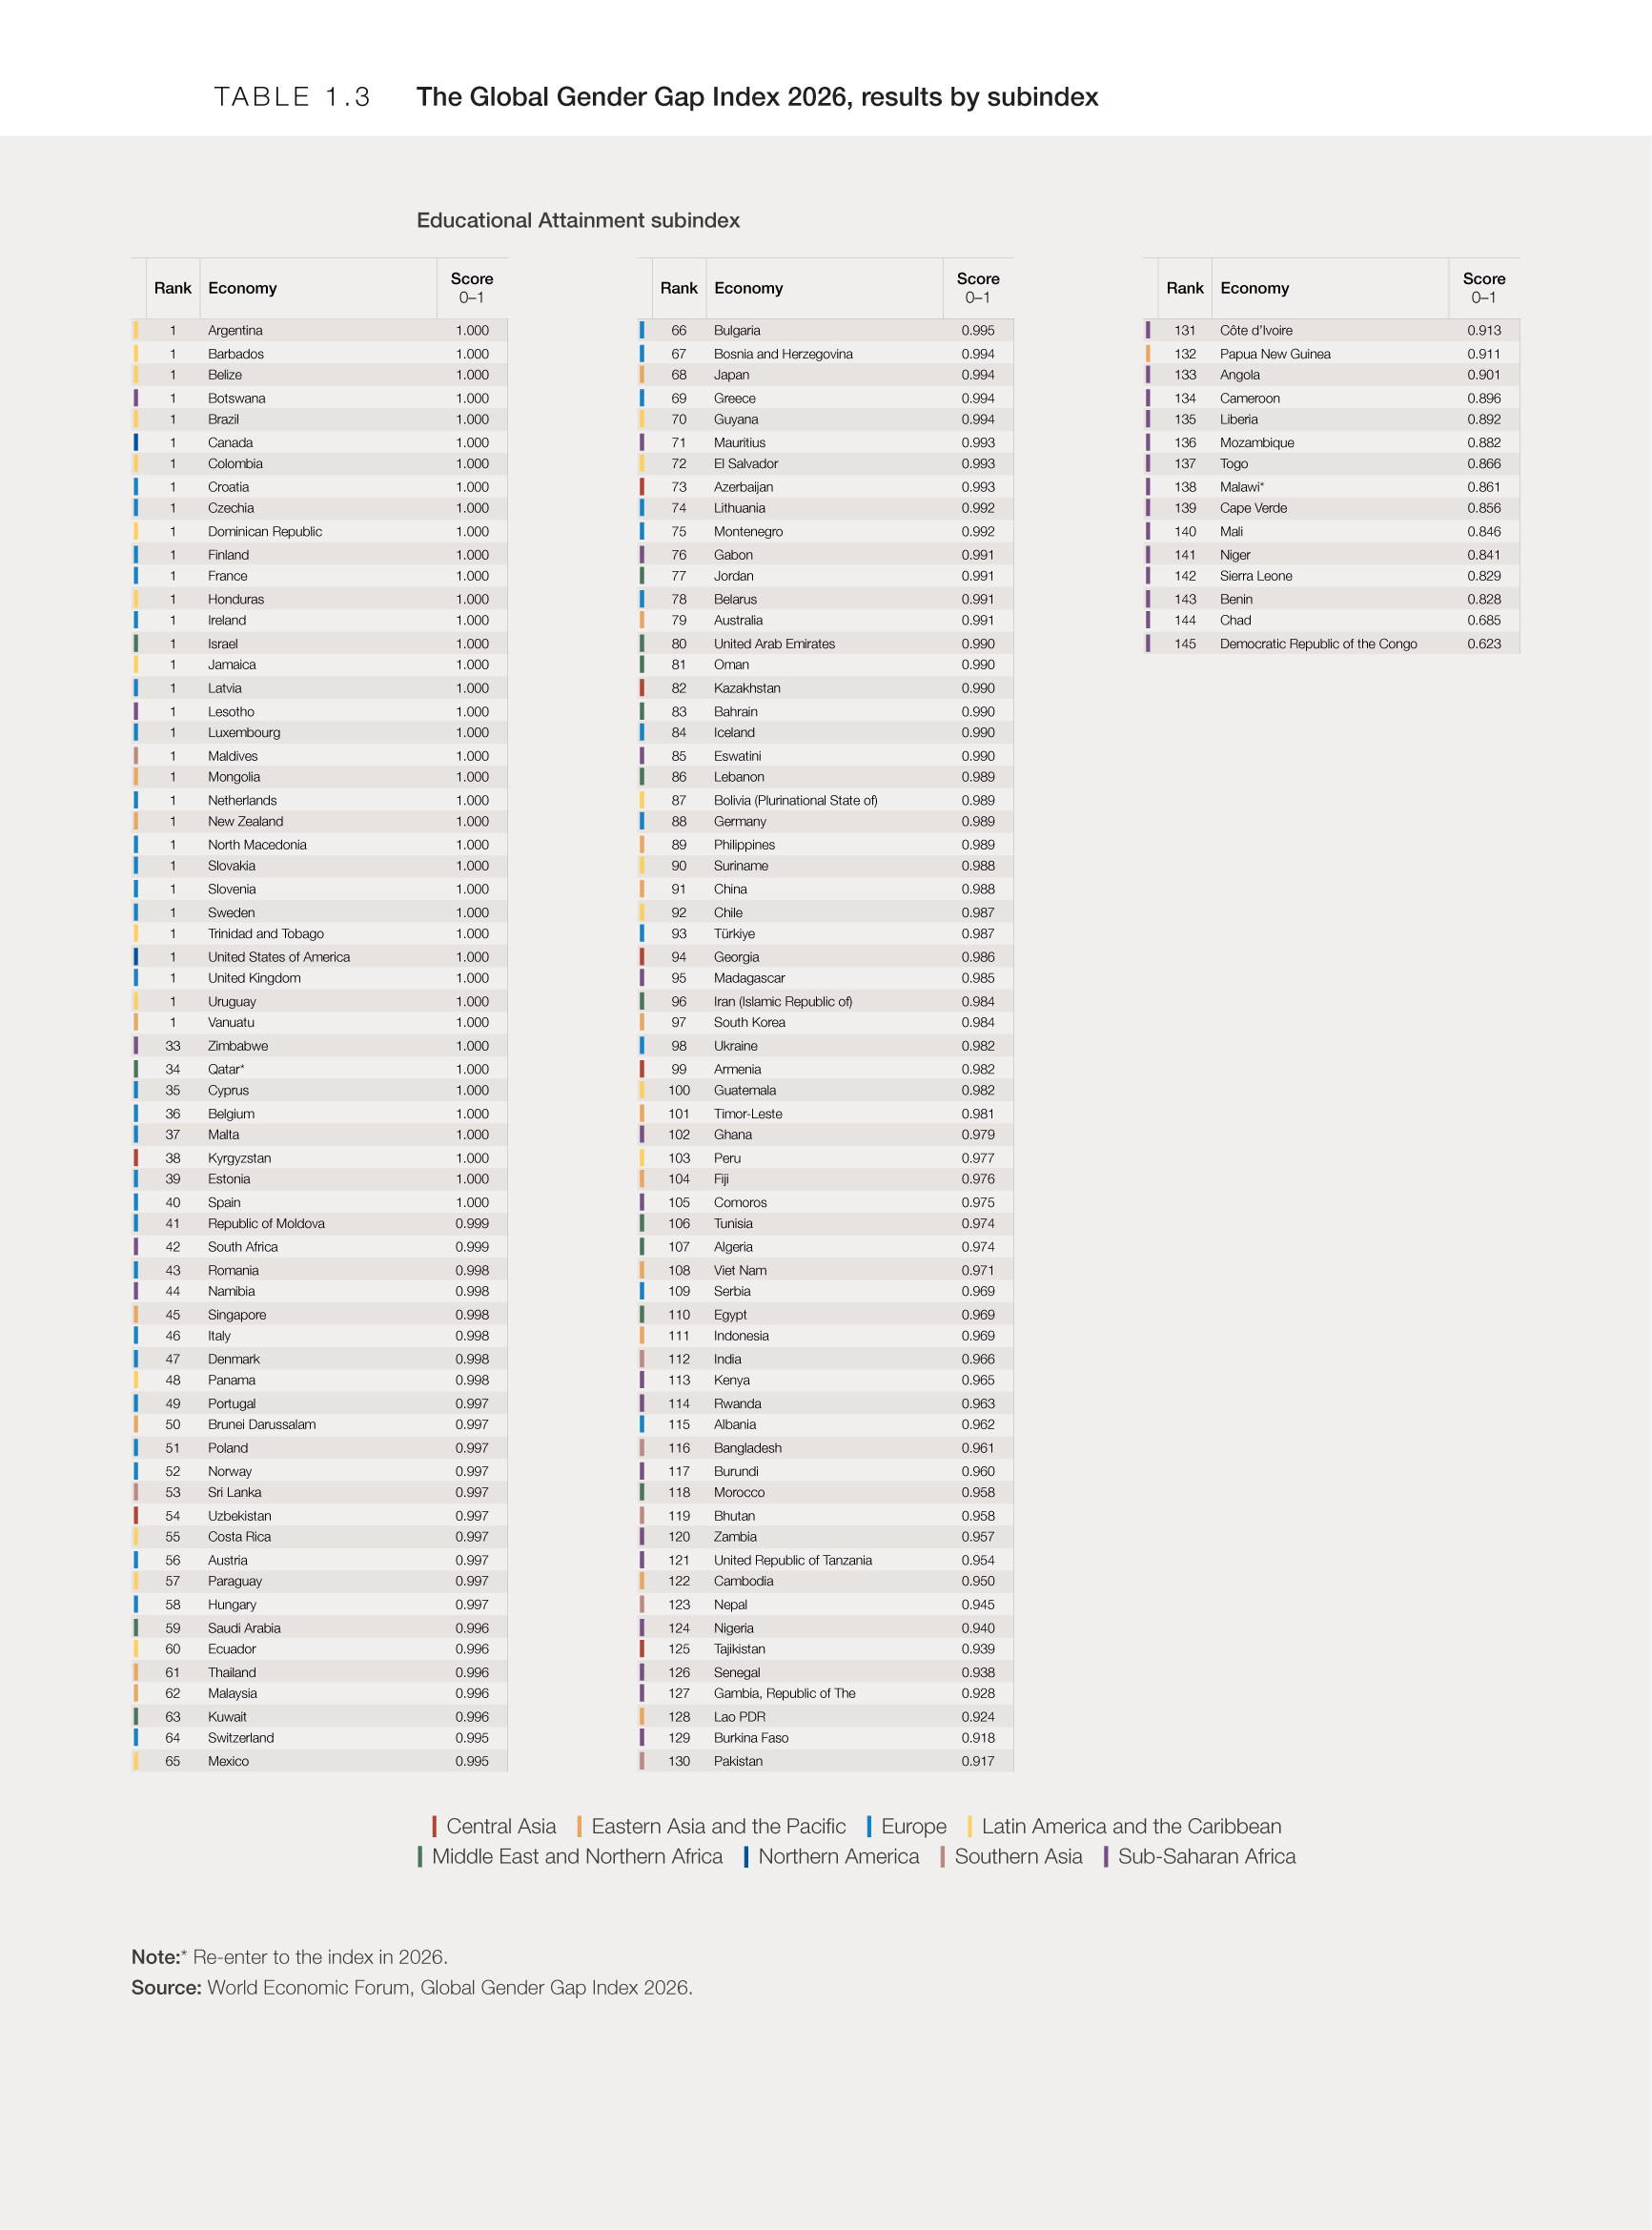
Similarly, 143 out of 145 economies have closed at least 80% of their gap in Educational Attainment, and 32 economies have achieved full parity (100%) in this subindex. At the other end of the distribution, Chad (68.5%) and Democratic Republic of the Congo (62.3%) remain the furthest from parity, with more than 30% of their gender gaps yet to close (Figure 1.5 and Table 1.3).
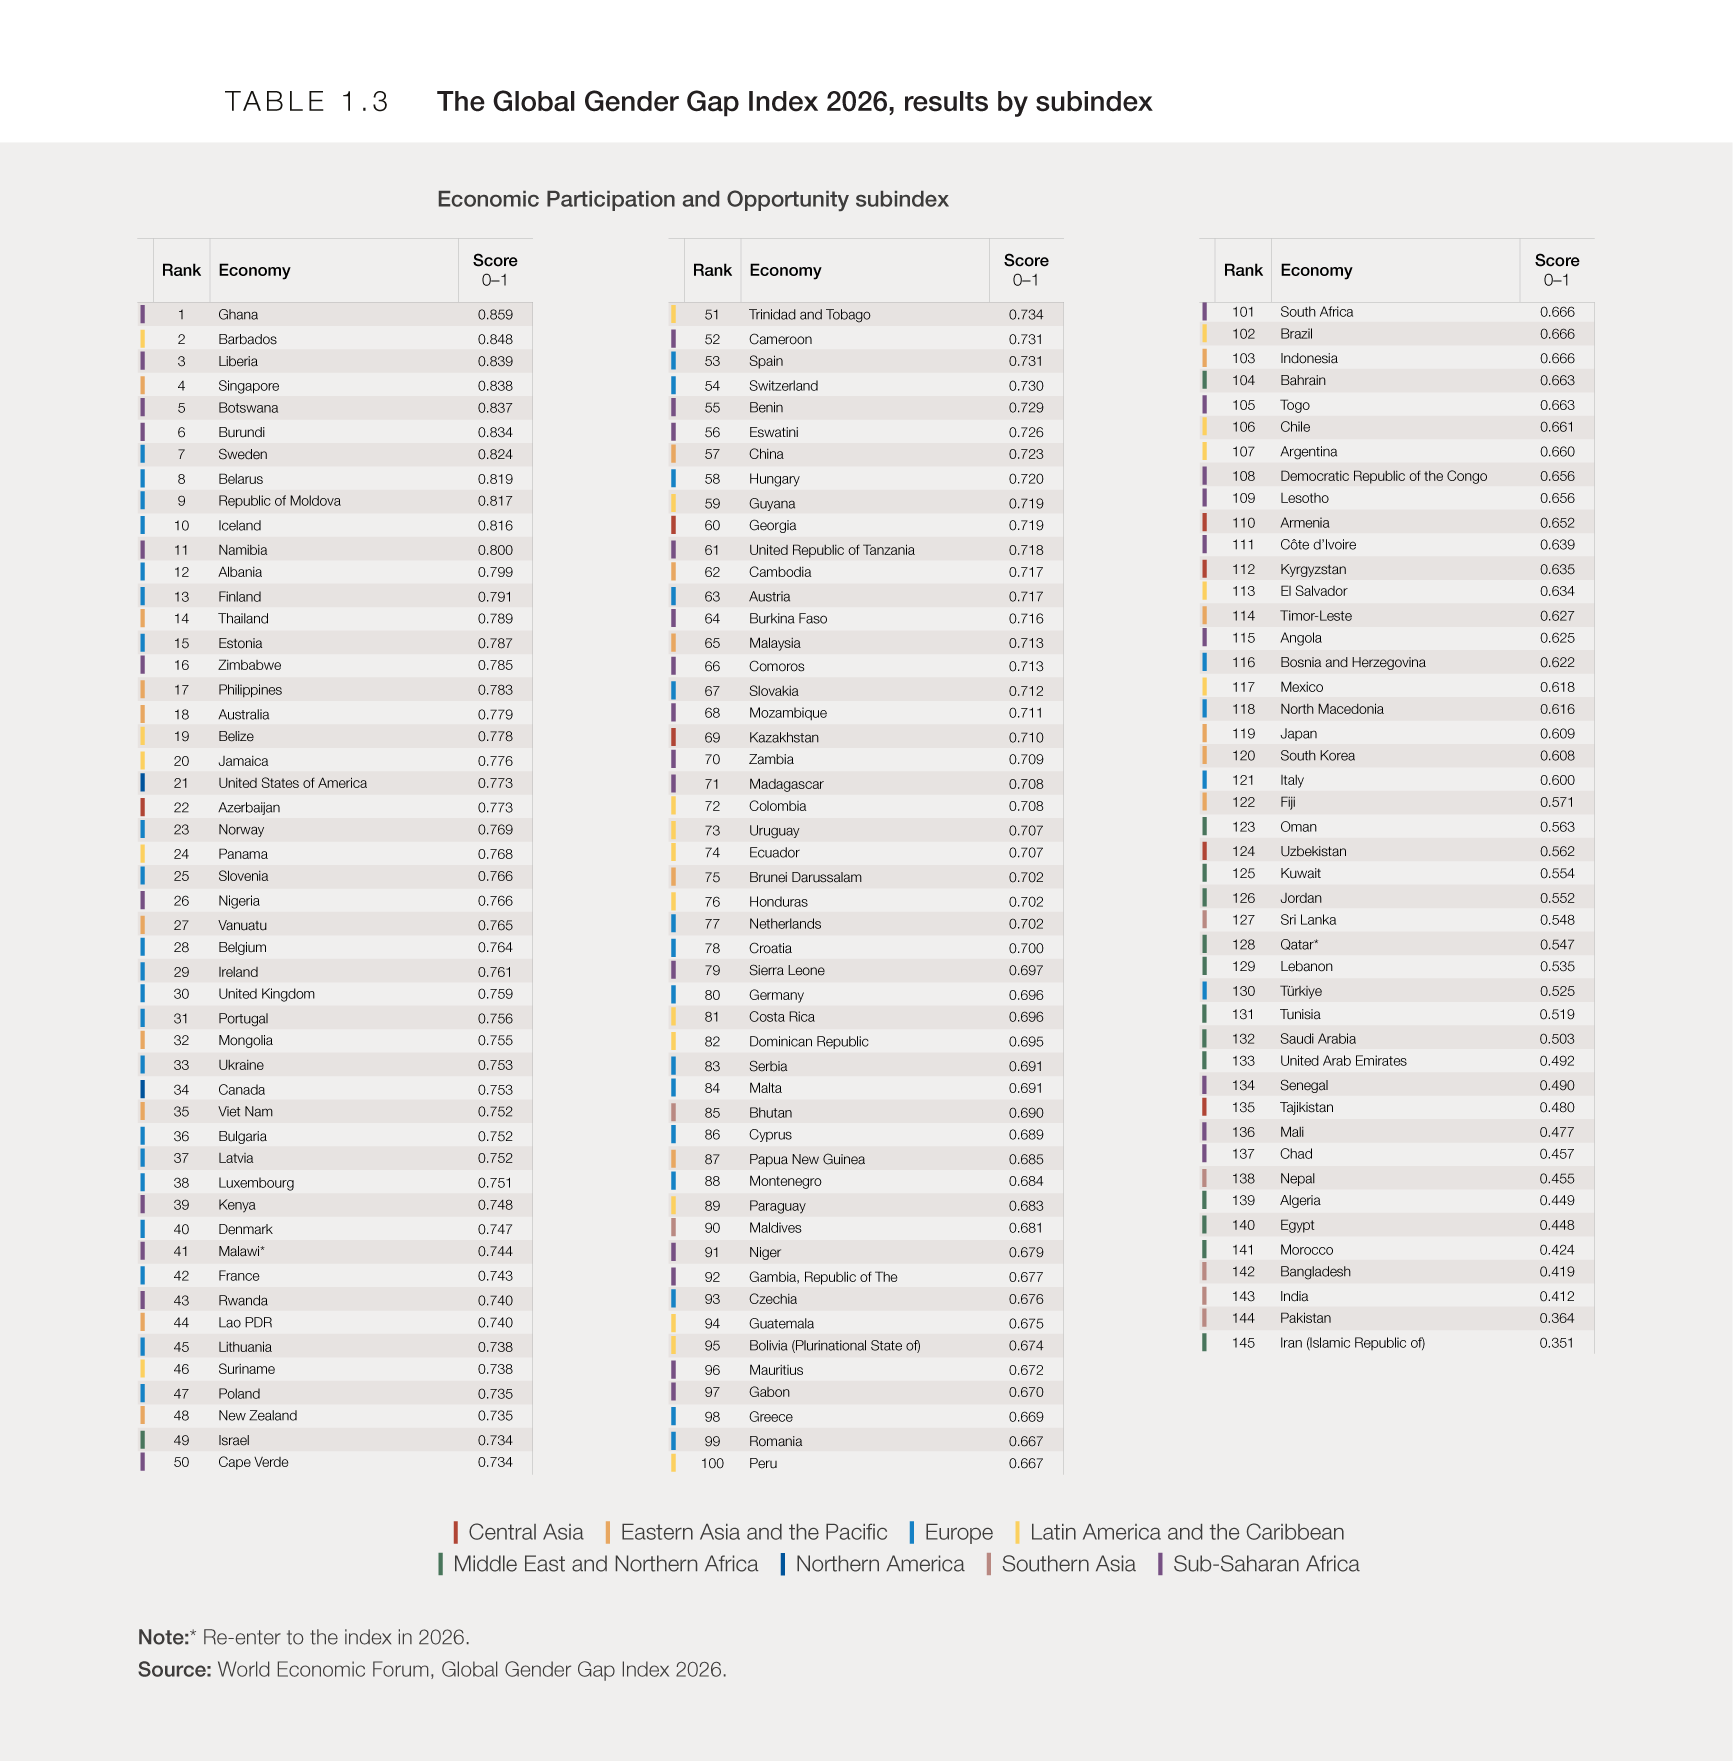
By contrast, Economic Participation and Opportunity exhibits greater variation across economies, with scores ranging from 35.1% in Iran (Islamic Republic of) to 85.9% in Ghana. Despite this wide overall range, the distribution is relatively concentrated around the middle: more than 80% of economies, spanning the second through ninth deciles, record scores between 51.9% and 78.7%, with only a limited number of economies lying at either extreme of the distribution (Figure 1.5 and Table 1.3).
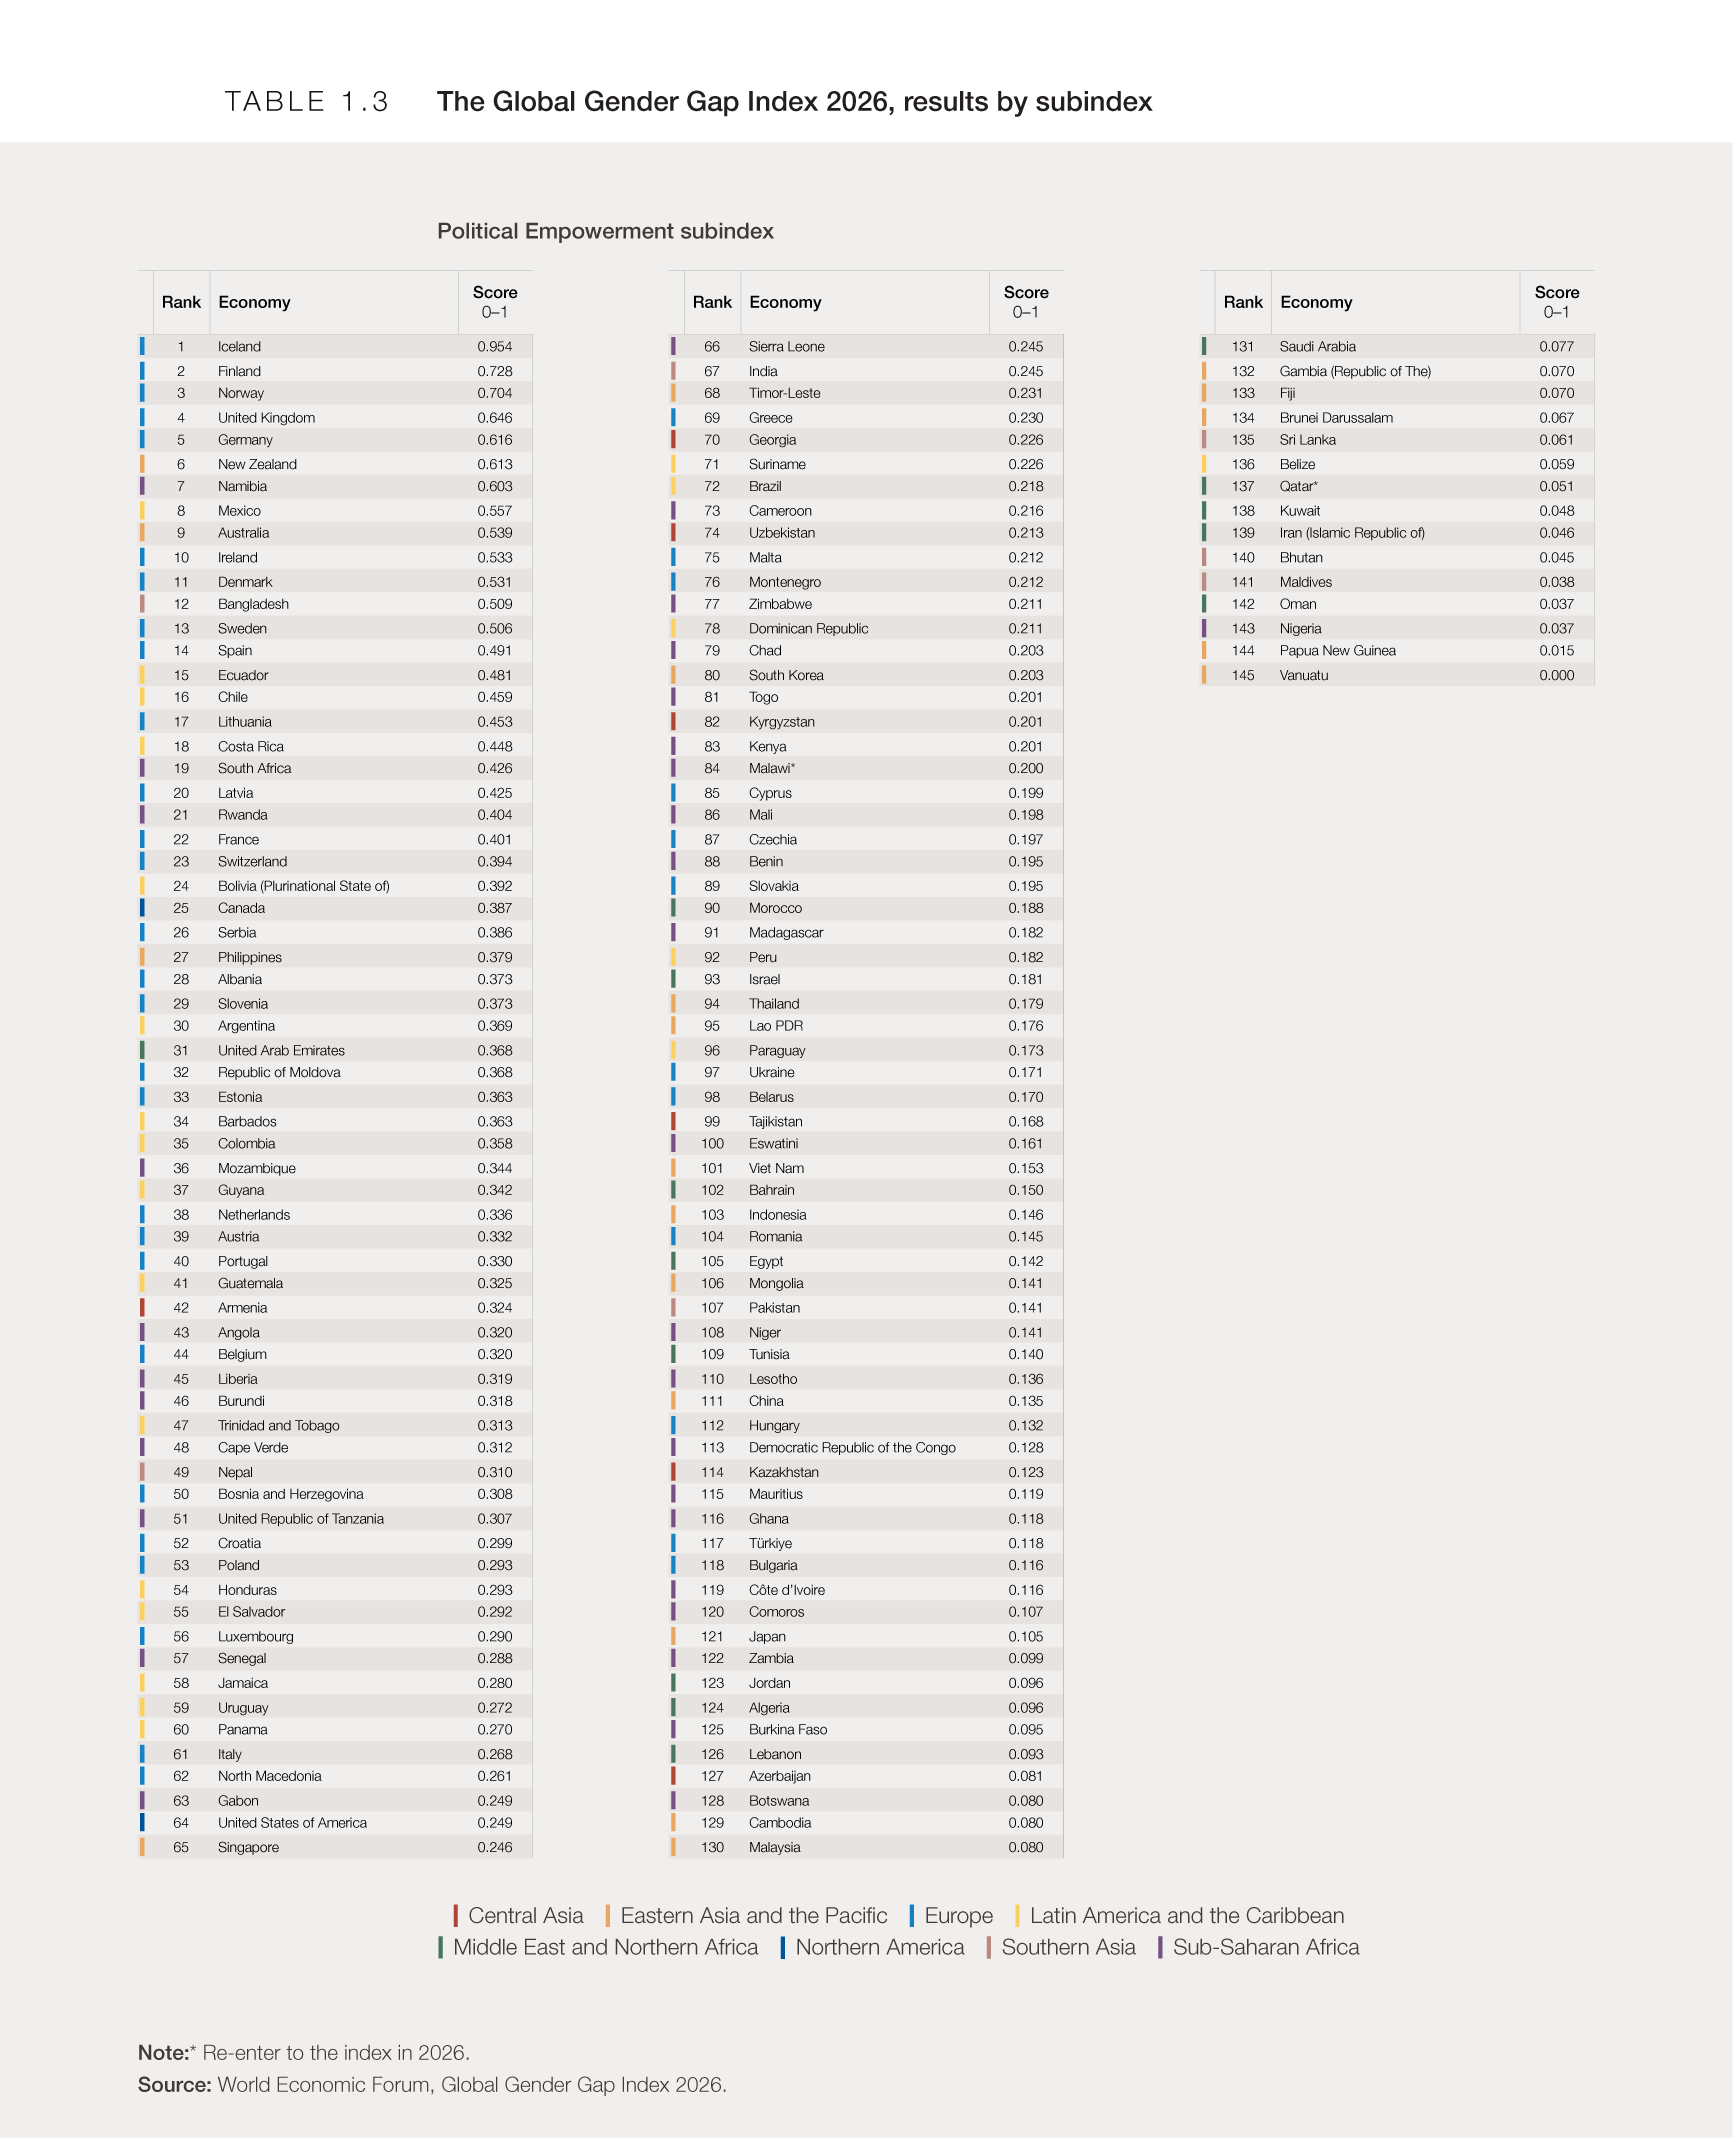
Political Empowerment displays by far the greatest cross-economy variation, with scores ranging from 0.6% in Vanuatu to 95.4% in Iceland. Unlike the other subindexes, where only a small number of economies trail the main distribution, the Political Empowerment subindex is characterized by a few high-performing outliers. Notably, Iceland (95.4%) is the only economy with over 90% of its gender gap closed in this subindex, followed by Finland (72.8%) and Norway (70.4%), while approximately 90% of economies score below 50% (Figure 1.5 and Table 1.3).

Within the subindex, the five underlying indicators reveal substantial differences in the state of gender parity. Indicators measuring overall labour-market participation and representation tend to exhibit higher levels of parity than those capturing women’s representation in leadership positions. Globally, parity is highest in representation among professional and technical workers (73.7%), with labour-force participation recording a parity score at 68%. By contrast, the share of women among legislators, senior officials and managers records the lowest parity score of the five indicators, at 41.7%. This pattern is also evident across individual economies, where 67 economies covered in the 2026 edition have achieved parity, or have a higher share of women than men, among professional and technical workers. However, only two economies have reached parity in the representation of legislators, senior officials and managers. Moreover, gains in workforce representation have not translated fully into economic outcomes. The perceived wage equality for similar work stands at 64.7%, while estimated earned income, a measure of the economic resources earned by women relative to men, has a parity score of 54.9%.
All four indicators comprising the Educational Attainment subindex have global parity scores above 90%, reflecting the relatively small gender gaps in access to education worldwide. Gender parity is highest in primary education enrolment (99.1%), followed by secondary education enrolment (98.4%) and tertiary education enrolment (97.4%). Adult literacy records a slightly lower parity score (90.8%), reflecting the cumulative effects of historical disparities, as the indicator covers the population aged 15 years and above rather than the current patterns in school enrolment. Cross-economy variation is limited across all four indicators, although a small number of economies lag behind. The largest remaining gaps are observed in adult literacy, particularly in Chad (41.9%) and Niger (53.6%), and in tertiary education enrolment, where Chad (39.4%) and Togo (57.0%), record the lowest parity scores. At the other end of the distribution, 111 economies covered in the 2026 edition have achieved parity, or have more women than men enrolled, in tertiary education. This is particularly noteworthy given that tertiary education generally lies beyond compulsory schooling. However, gender parity in tertiary enrolment has not translated into equal representation across fields of study. Among the 117 economies with available data, only Botswana records a slightly reversed gender gap in the share of tertiary graduates in science, technology, engineering and mathematics (STEM) fields.
The Health and Survival subindex comprises two indicators, both of which exhibit parity levels close to their respective benchmarks and relatively little variation across economies. Globally, the female-to-male sex ratio at birth stands at 93.4%, against a parity benchmark of 94.4%, while parity in healthy life expectancy reaches 102.7%, relative to a parity benchmark of 106.0%. Azerbaijan is the only economy among the 145 covered in the 2026 edition with a sex ratio at birth below 90% (89.8%). For healthy life expectancy, 19 economies report women having a slightly shorter healthy life expectancy than men, with parity scores ranging between 97% and 100%.
The Political Empowerment subindex comprises three indicators. Globally, parity is highest in representation in parliamentary positions (32%), followed by representation in ministerial positions (23.7%), while the parity score for years with a female head of state over the past 50 years is much lower, at 14.4%. Across economies, all three indicators span the full range of possible scores from 0 to 100%. For parliamentary representation, parity ranges from 0 in Oman, where no women serve in parliament, to full parity (100%) in Bolivia, Costa Rica, Mexico, Rwanda and the United Arab Emirates. The middle 80% of economies record parity scores ranging from 10.8% to 76.5%. A similar pattern is observed for ministerial representation. Hungary, Saudi Arabia, the United Arab Emirates and Vanuatu have no women serving in ministerial positions, while Australia, Canada, Colombia, Ecuador, Finland, Germany, Guatemala, Iceland, Namibia, Spain, Sweden and the United Kingdom have achieved parity in cabinet representation. The middle 80% of economies record parity scores between 9.1% and 85.3%. Representation among heads of state over the past 50 years is the most unevenly distributed of the three indicators. Sixty-four of the 145 economies covered in the 2026 edition have had no female head of state during this period, while Bangladesh and Iceland are the two economies to have reached parity on this indicator. Beyond these two economies, Finland (50.3%), Norway (56.7%), and Ireland (74.7%) record parity scores above 50%.






Progress over time
This section examines the evolution of gender gaps in the Global Gender Gap Index and its four subindexes: Economic Participation and Opportunity, Educational Attainment, Health and Survival, and Political Empowerment. In addition to comparing results between the 2025 and 2026 editions, it reviews global progress since the inaugural edition of the report in 2006 and estimates the time required to close the remaining gender gaps across the index and its subindexes.
Among the 143 economies covered in both the 2025 and 2026 editions, the global gender gap narrowed by 0.4 percentage points, with overall parity improving from 68.8% in 2025 to 69.2% in 2026. This progress was driven primarily by gains in Educational Attainment, where parity increased by 1.6 percentage points, from 95.3% to 96.9%. Smaller improvements were also recorded in Economic Participation and Opportunity, which rose by 0.4 percentage points (from 61.3% to 61.7%), and Health and Survival, which edged up from 96.1% to 96.2%. However, these advances were partially offset by a decline in Political Empowerment, where parity fell by 0.4 percentage points, from 22.5% in 2025 to 22.1% in 2026.
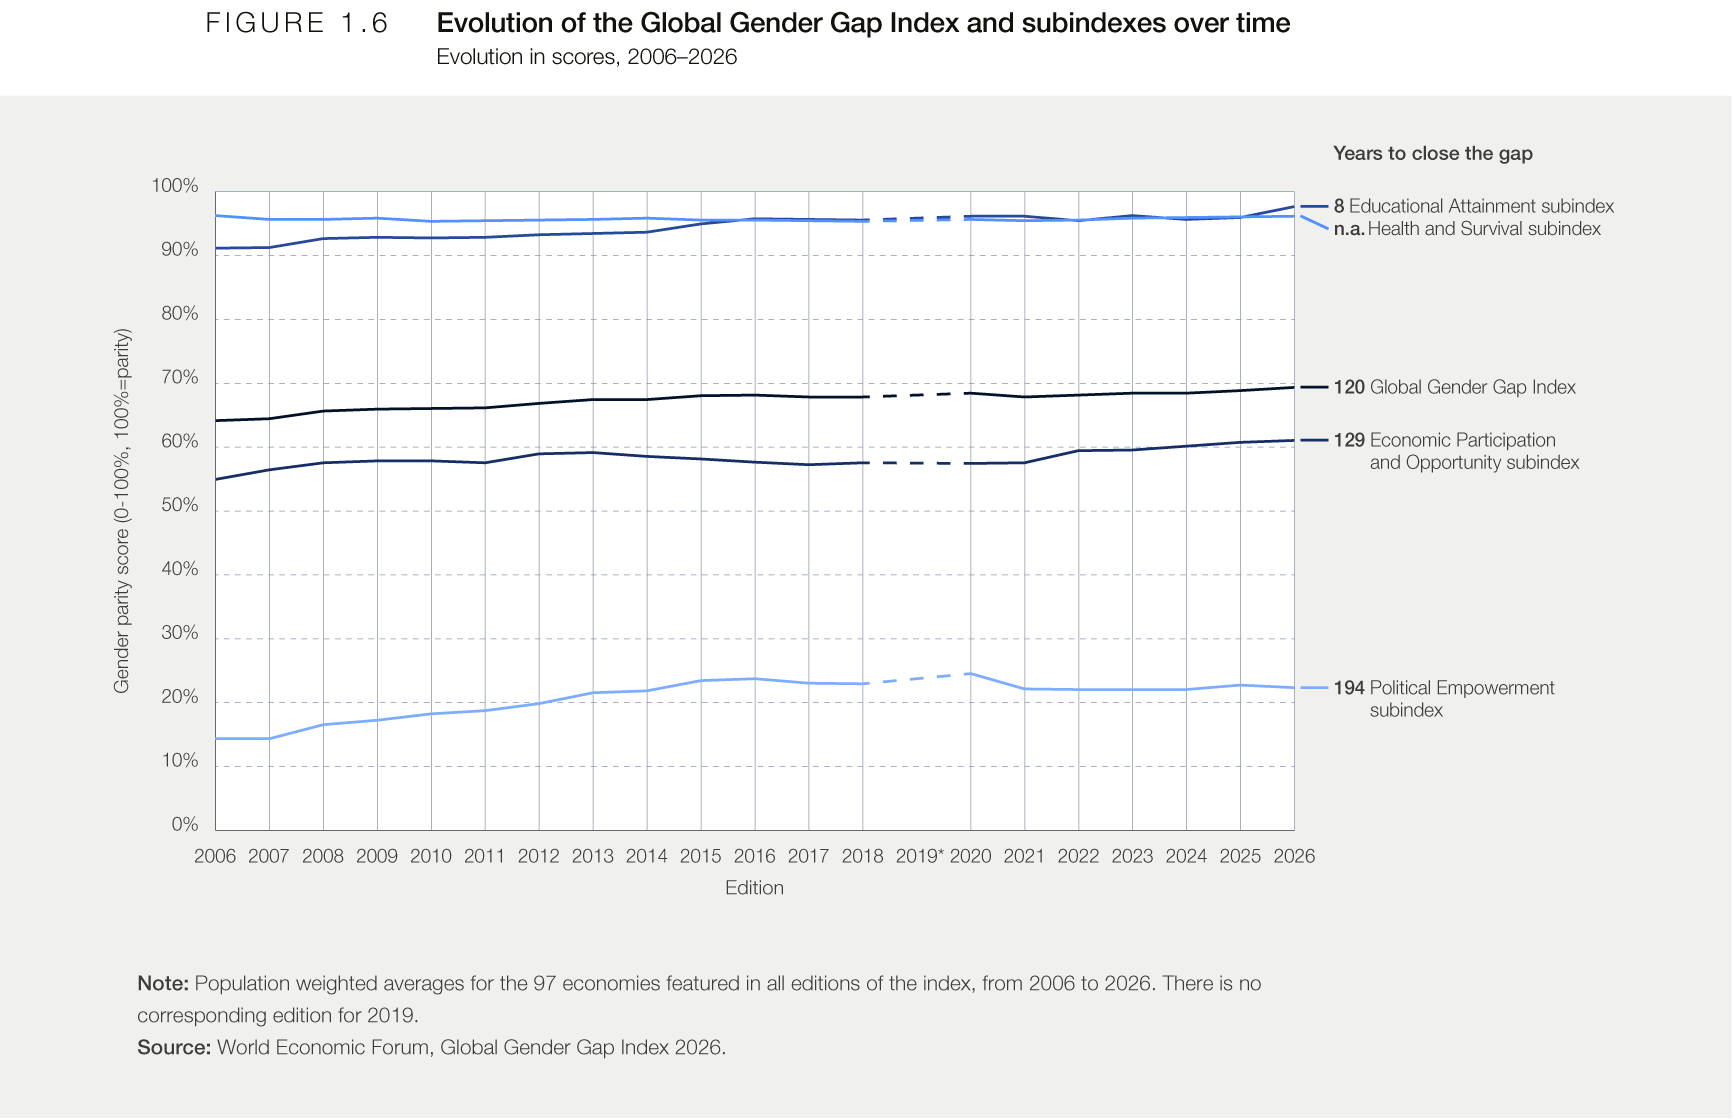
Over the 20 editions since 2006, the report has constantly tracked 97 economies over each edition. Figure 1.6 shows the 20-year trajectory of the population-weighted average of these 97 economies.
Over the past 20 editions, the Global Gender Gap Index score has increased +5.2 percentage points across the 97 economies featured in all editions, from 64.2% in the 2006 edition 69.4% in the 2026 edition – its highest score to date. If these economies were to continue to advance at this estimated rate of progress, global gender parity is estimated to be attained in 120 years.
Over the same period, the global parity score for the Economic Participation and Opportunity subindex has increased by +6.1 percentage points, from 55% in the 2006 edition to 61.1% in the 2026 edition – the highest level recorded to date. If progress continues at its historical pace, global gender parity in this subindex is projected to be reached in 129 years (Figure 1.6).

All five indicators underlying the subindex have improved since 2006, although progress has been uneven. The largest gains have been in women's representation in relatively skilled and senior positions. The parity score for legislators, senior officials and managers increased by 15.8 percentage points, from 24.9% to 40.6%, representing the greatest improvement despite remaining the weakest-performing indicator of the subindex to date. Parity score for professional and technical workers recorded the second-largest gain, increasing by +8.8 percentage points, from 65.7% to 74.5%. Progress in labour-force participation has been more gradual. The parity score increased by +2.9 percentage points, from 63.7% in 2006 to 66.5% in 2026, reflecting the slower pace of change in overall participation across the broader labour market. Improvements in labour-market representation have also not been fully matched by progress in economic outcomes. Estimated earned income improved by +2.7 points over the period, from 50.8% in 2006 to 53.5% in 2026, while perceived wage equality for similar work increased by +1.8 percentage points, from 62.8% to 64.5% over the same period.
The Educational Attainment subindex also shows improvements over the past two decades, with its global parity score increasing by +6.5 percentage points, from 91.2% in the 2006 edition to 97.7% in the 2026 edition, the highest level recorded to date. If progress continues at its historical pace, global gender parity in this subindex is projected to be reached in eight years (Figure 1.6).
The overall improvement in the subindex has been driven primarily by progress in tertiary education enrolment, where the parity score increased by +17.2 percentage points, from 81.3% in 2006 to 98.5% in 2026. The remaining three indicators also recorded gains over the same period, although from comparatively higher starting levels. Adult literacy improved by +7.7 percentage points, from 84.2% to 91.9%; secondary education enrolment increased by +7.5 percentage points, from 91.8% to 99.3%; and primary education enrolment rose by nearly 3 percentage points, from 96.3% to 99.2%.
The global parity score for the Health and Survival subindex has remained broadly stable over the past two decades, edging down by 0.1 percentage points from 96.3% in the 2006 edition to 96.2% in the 2026 edition (Figure 1.6).
This stability reflects offsetting trends in the two underlying indicators. The parity score for the sex ratio at birth increased only minimally, by just +0.1 percentage points, from 93.3% to 93.4%, while the parity score for healthy life expectancy recorded a small net decrease..
The Political Empowerment subindex has recorded the greatest improvement since 2006, with its global parity score increasing by +8 percentage points across the constant sample of 97 economies, from 14.4% in the 2006 edition to 22.4% in the 2026 edition, slightly below the record high of 24.6% reached in the 2020 edition. Although this represents the largest improvement among the four subindexes since 2006, Political Empowerment remains the subindex with the largest remaining gap to close. If economies continue to advance at the historical rate of progress, global gender parity in this subindex is projected to be reached in 194 years (Figure 1.6).
Progress has been driven primarily by gains in women's representation in parliamentary and ministerial positions. The parity score for representation in parliamentary positions increased by +13.5 percentage points, from 17.9% in 2006 to 31.4% in 2026, while the parity score for representation in ministerial positions rose by +11.1 percentage points, from 12.4% to 23.5%. By contrast, progress has been more limited in the share of years with a female head of state over the past 50 years, where the parity score increased by +2.6 percentage points, from 13% to 15.5%.
Performance by region
Consistent with previous editions, the Global Gender Gap Report 2026 groups economies into eight regional clusters: Central Asia, Eastern Asia and the Pacific, Europe, Latin America and the Caribbean, Middle East and Northern Africa, Northern America, Sub-Saharan Africa, and Southern Asia. The regional composition is used throughout the report for comparative analysis. A complete list of economies included in each regional group is provided in Appendix A.



Central Asia
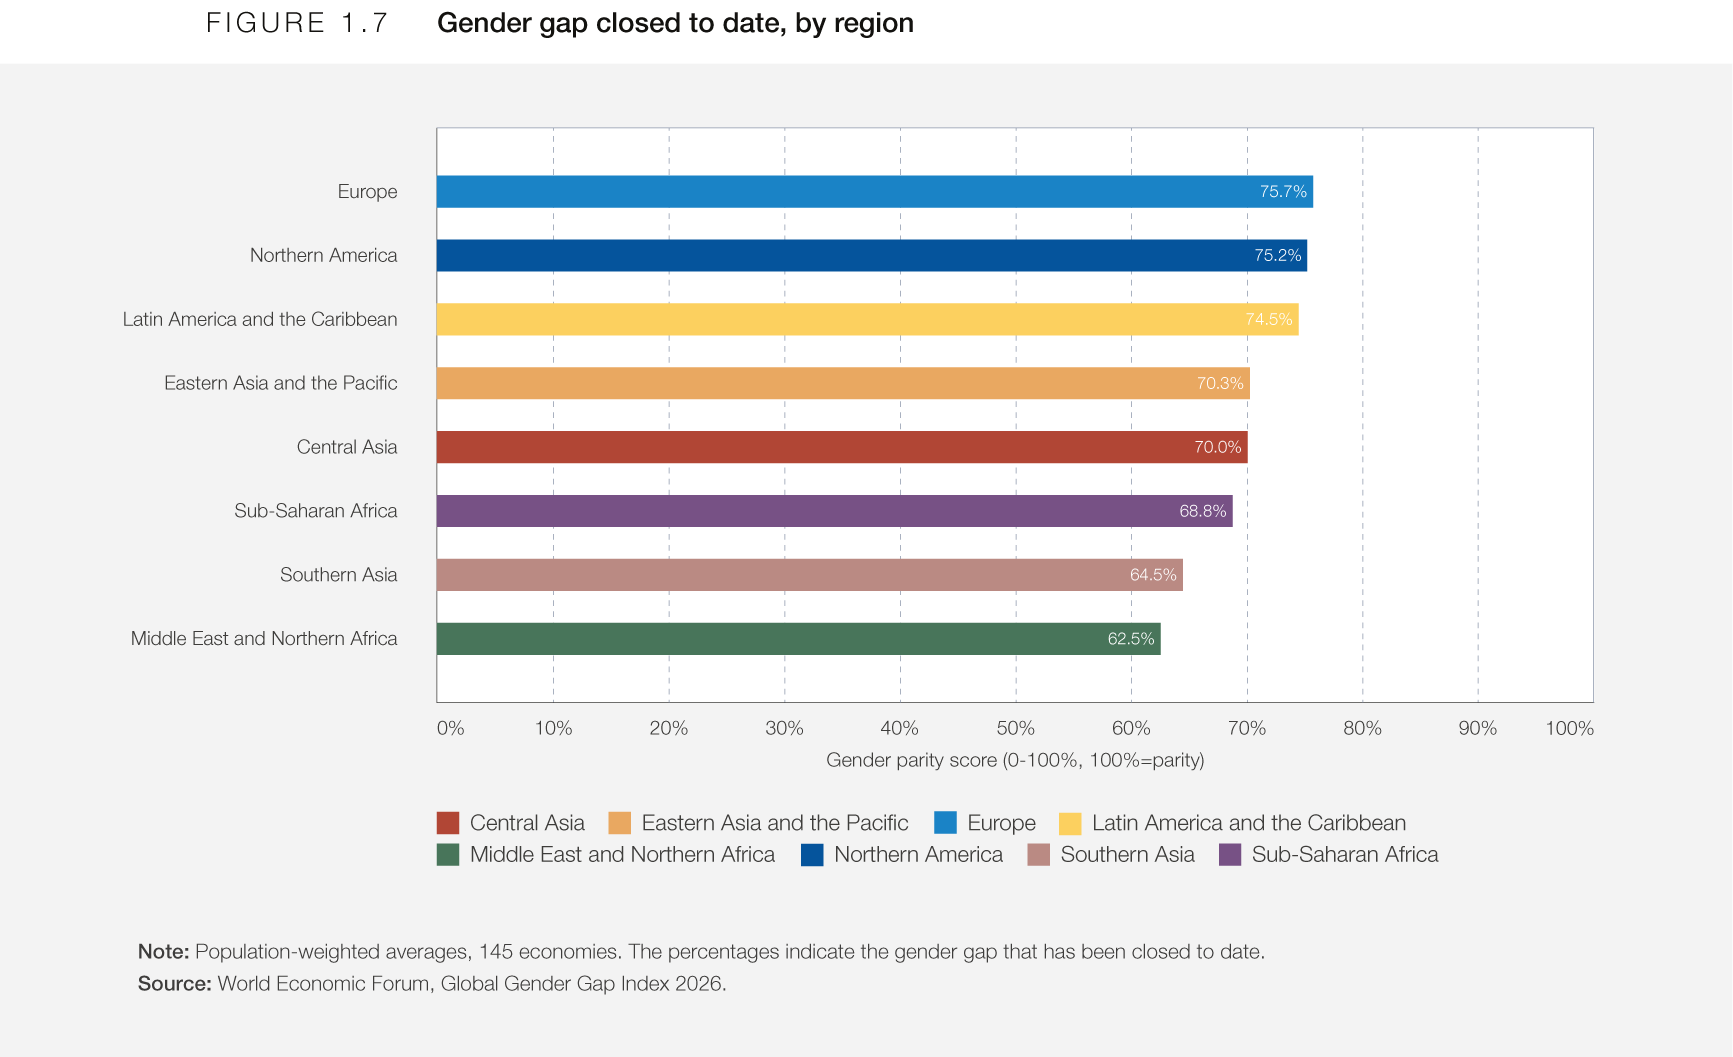
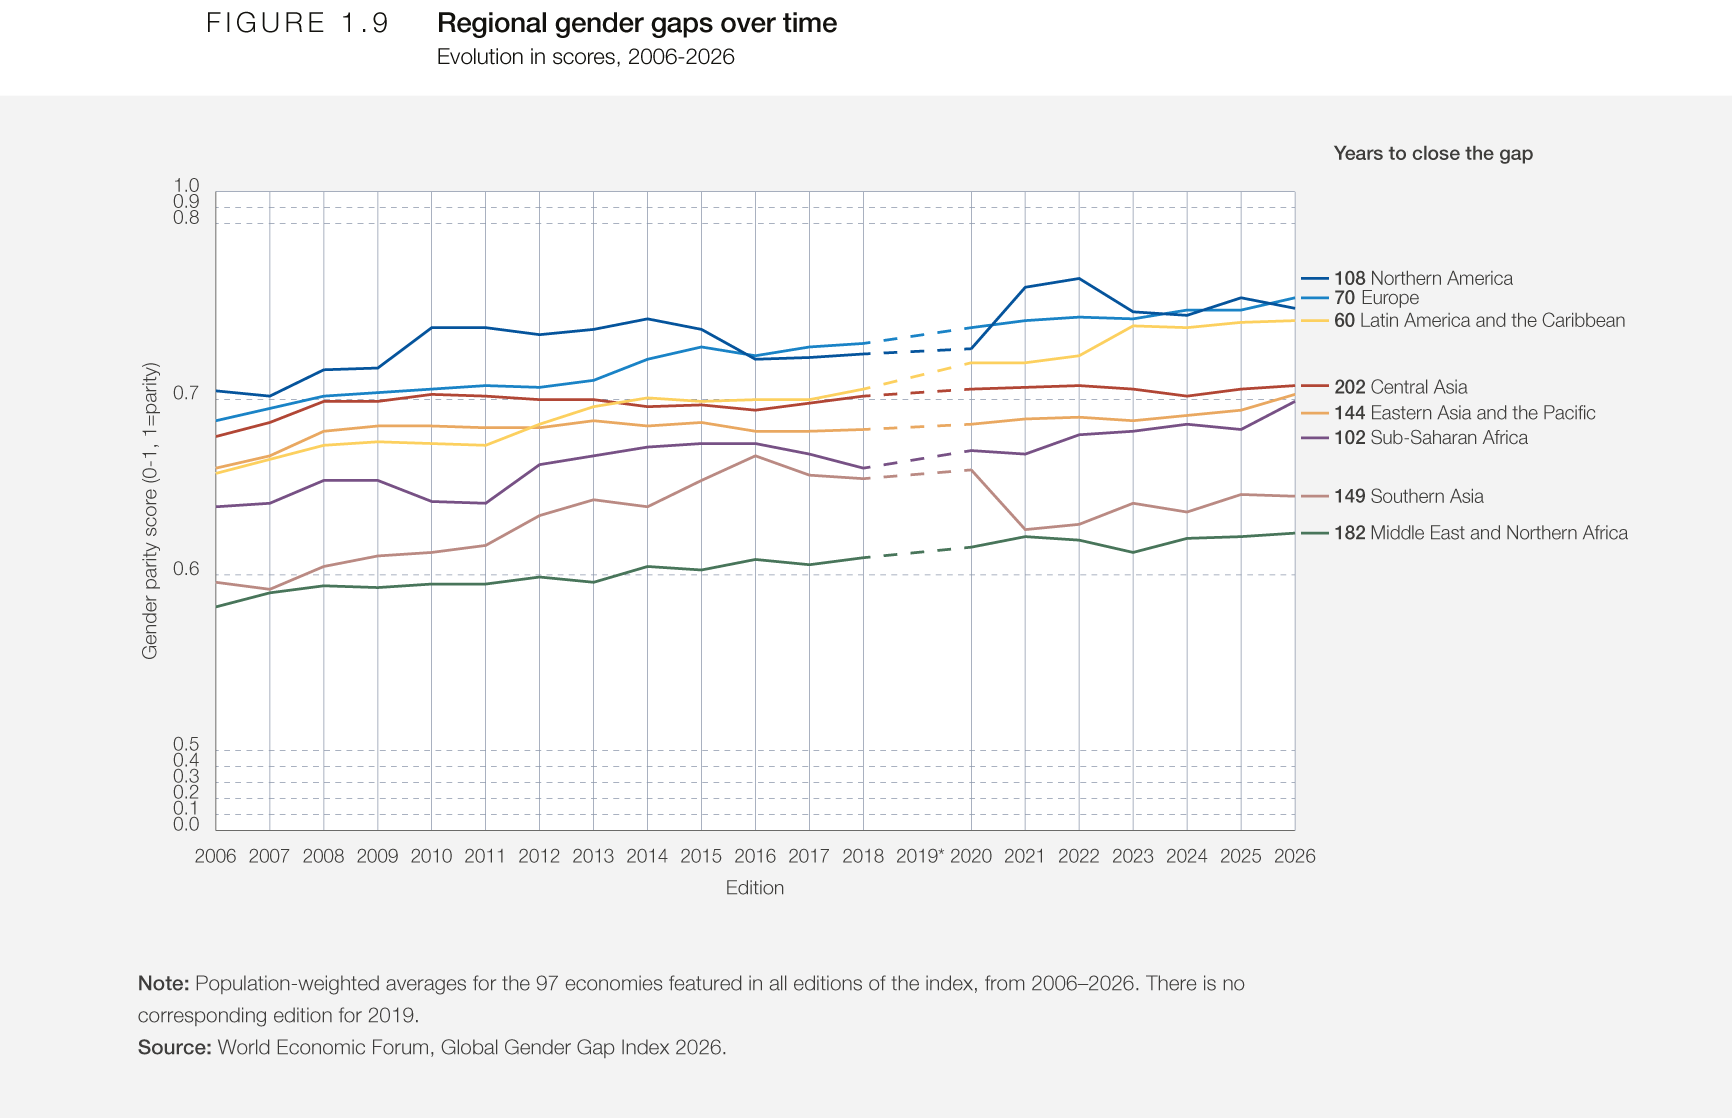
In 2026, Central Asia has closed 70.0% of its overall gender gap, improving slightly from the previous edition and by +2.9 percentage points since 2006 among the economies consistently covered over the period (Figure 1.7). At its current pace of progress, the region is projected to be the last region to reach full parity, in 202 years (Figure 1.9).
The regional grouping comprises seven economies in 2026, five of which rank among the global top 100: Armenia (73.1%, 58th), Georgia (72.7%, 60th), Kyrgyzstan (70.4%, 88th), Kazakhstan (70.0%, 95th) and Azerbaijan (69.7%, 98th).The difference between the highest- and lowest-scoring economies is less than 10 percentage points, making Central Asia the second-most homogeneous region after Northern America.
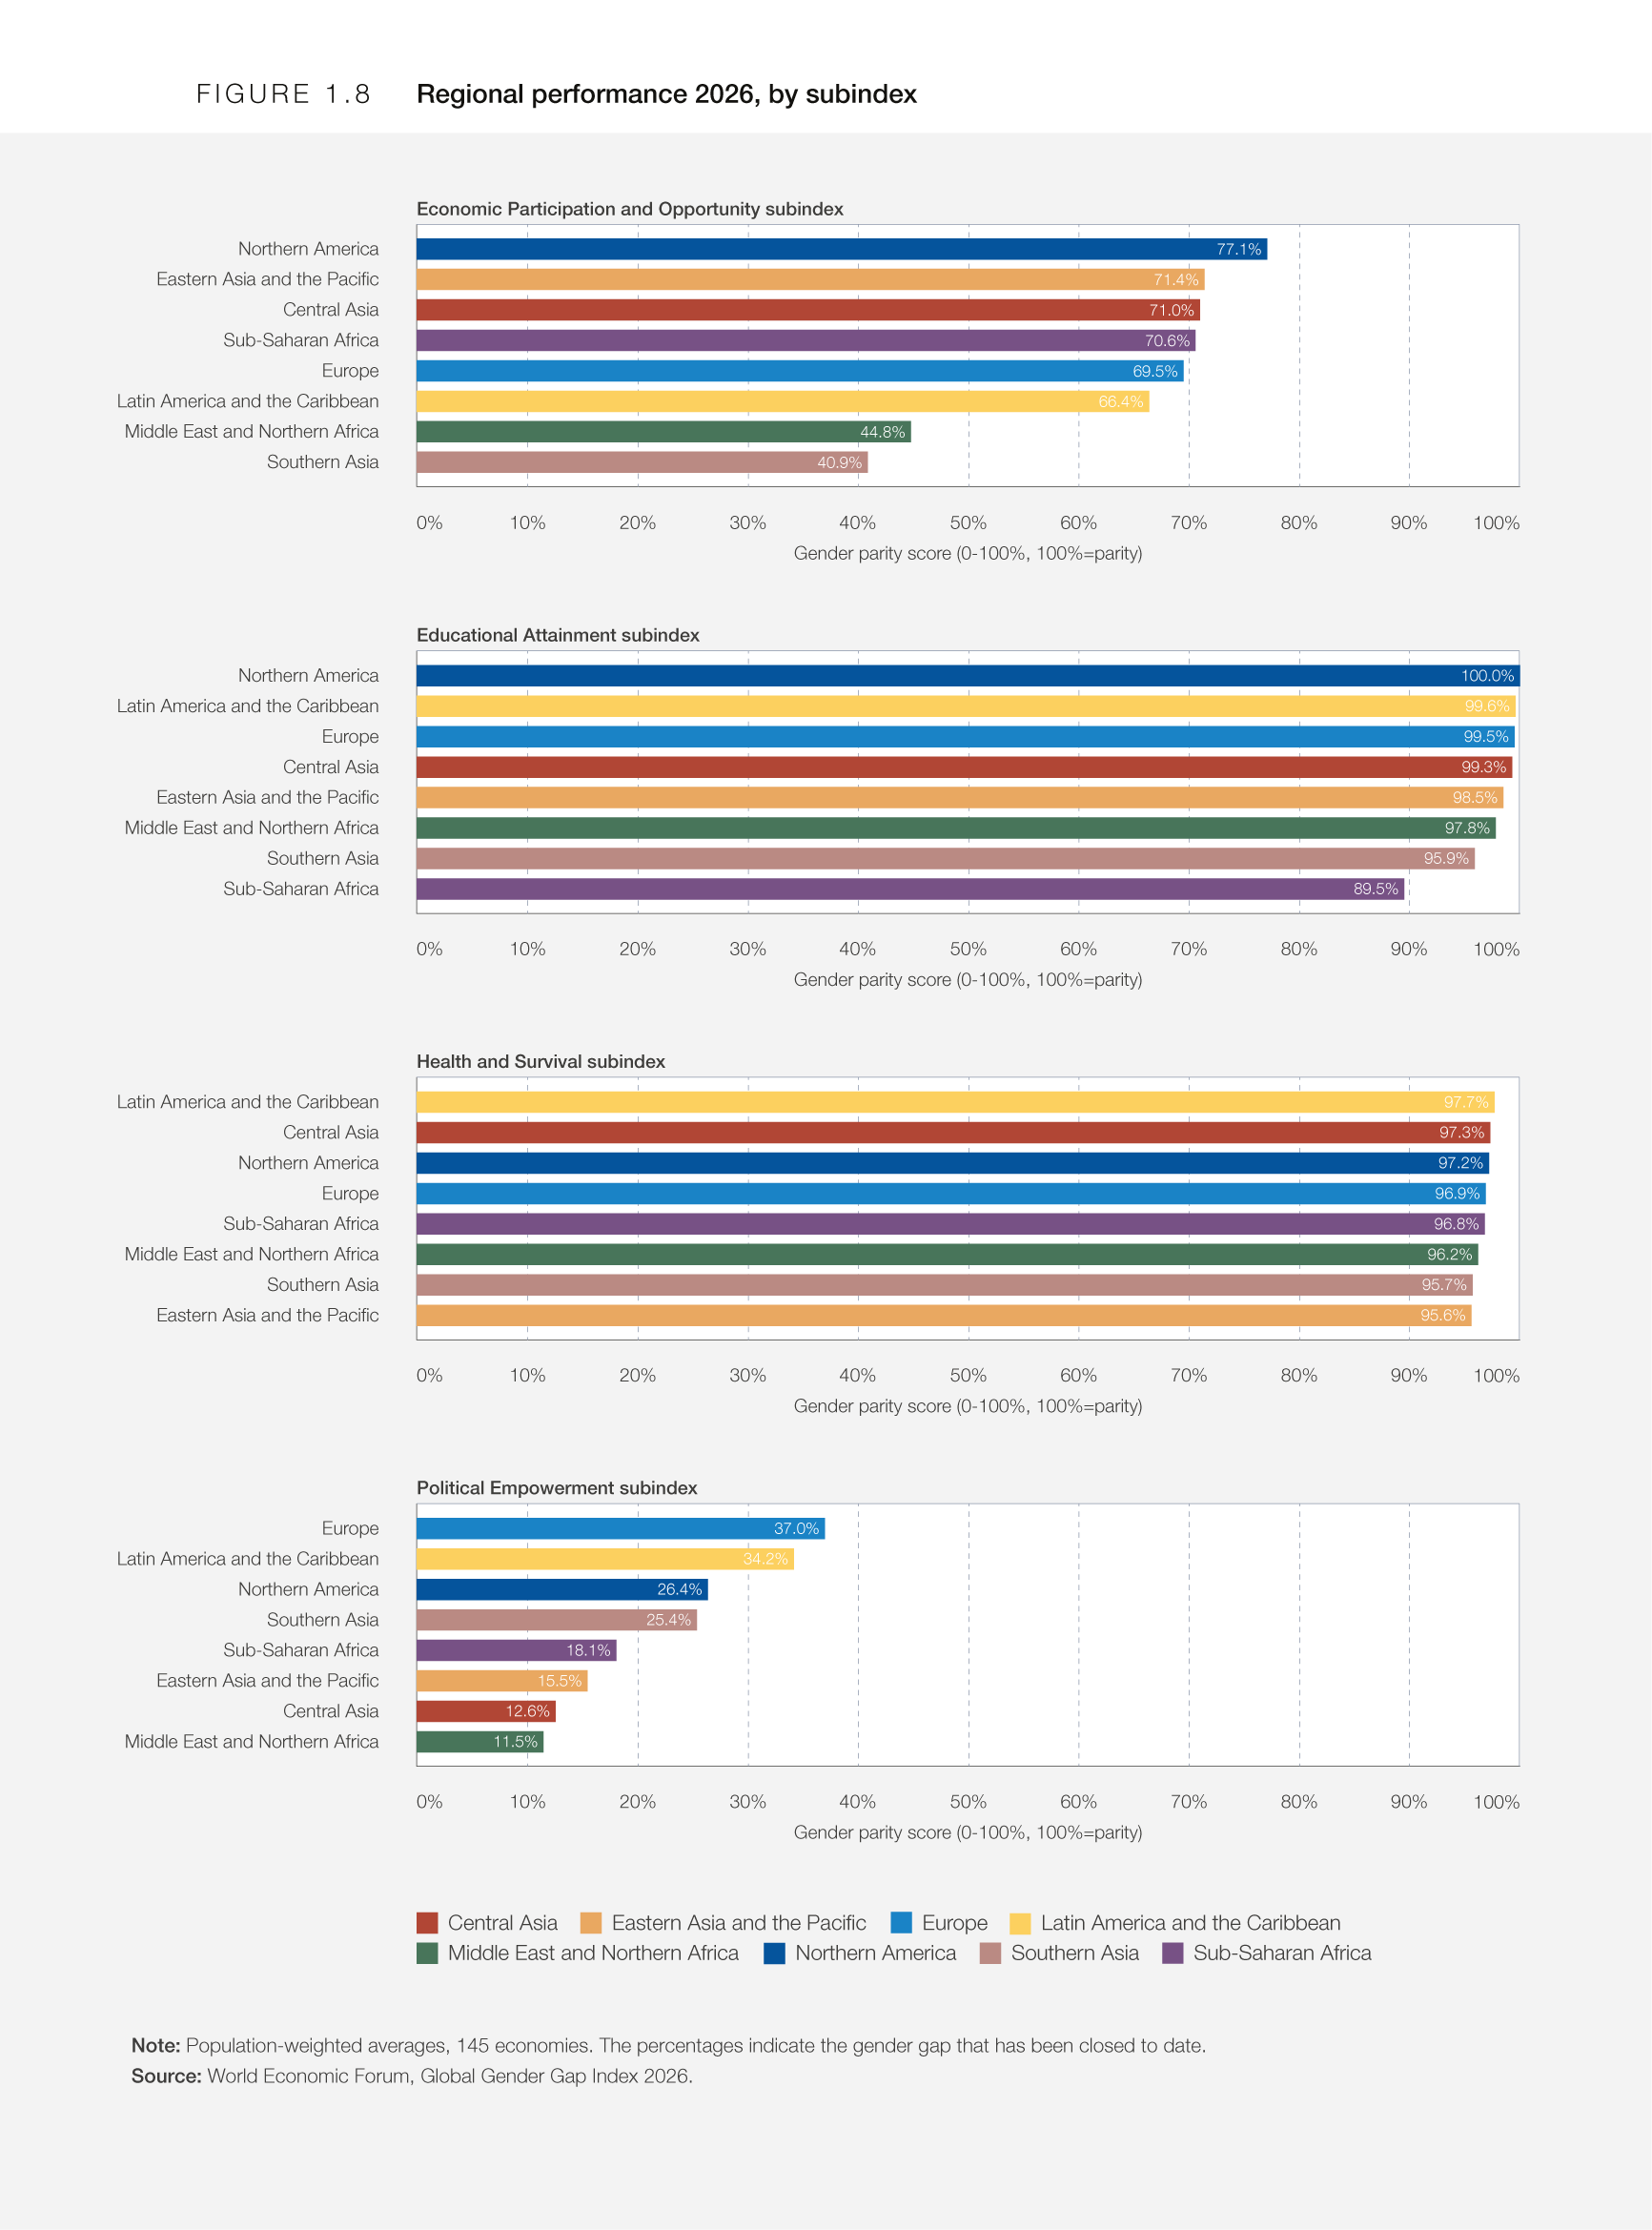
Central Asia records one of its strongest performances in Economic Participation and Opportunity, where it has closed 71.0% of the gender gap, ranking third globally behind Northern America (77.1%) and Eastern Asia and the Pacific (71.4%) (Figure 1.8). Since 2006, the region has narrowed its economic gender gap by 5.5 percentage points, with its parity score rising from 69.7% to 75.2%. Much of this improvement has been driven by greater parity among legislators, senior officials and managers. Regional progress on this indicator accelerated during the second decade of the index, with the regional score increasing from 62.2% in 2016 to 79.6% in 2026.
In Educational Attainment, Central Asia achieves a parity score of 99.3% in 2026, placing fourth among the eight regions (Figure 1.8). Despite remaining close to full parity, this dimension is the only one in which the region has recorded a slight deterioration over the past two decades. In fact, educational parity has declined by 0.3 percentage points since 2006, falling from 99.8% to 99.5% after reaching full parity in 2015. The decline is primarily explained by lower parity in secondary education enrolment, where the score decreased by 1.6 percentage points, from 99.9% in 2006 to 98.3% in 2026.
Central Asia ranks second globally in Health and Survival, with a parity score of 97.3%, trailing only Latin America and the Caribbean (97.7%) (Figure 1.8). The region has largely maintained its strong performance in this dimension throughout the life of the index.
Political Empowerment is the dimension where Central Asia has made the greatest long-term gains. Since 2006, the region has reduced its political gender gap by 6.3 percentage points among the constant sample of economies. This progress has been driven primarily by greater representation of women in national parliaments, where parity has improved by 12.4 percentage points over the past two decades. Despite these gains, Political Empowerment remains the region’s weakest dimension: in 2026, Central Asia has closed just 12.6% of its political gender gap, leaving it with the second-largest remaining gap after the Middle East and Northern Africa (11.5%).
Eastern Asia and the Pacific
In 2026, Eastern Asia and the Pacific records an overall gender parity score of 70.3%, passing the 70% threshold for the first time with the remaining top half of the regional ranking (Figure 1.7). Alongside this increase in its overall parity score, the region gains one rank compared to last edition, placing fourth out of eight. Compared with last edition, the region improves its overall score by +0.9 percentage points. This advance boosts the region’s overall trajectory, which has narrowed its overall gender gap by 4.2 percentage points since the index was first launched (sixth-highest reduction among the eight regions). This places Eastern Asia and the Pacific fifth in line to close the gap, in 144 years (Figure 1.9).
Out of the 19 economies included in this regional group in 2026, the top two feature in the global top 10, with more than 80% of the gap closed: New Zealand (82.8%, 6th) and Australia (81.9%, 8th). Two other economies, the Philippines (78%, 20th) and Singapore (76.4%, 31st), rank within the top 50 in this edition. Remaining economies show a wide score dispersion at the index level, with 10 economies in the group sitting below the 70% mark, the lowest of which is posted by Papua New Guinea (64.2%, 132nd).
In this edition, the region records the second-highest economic parity score, with 71.4% of the gap closed, behind Northern America (77.1%) (Figure 1.8). Considering all Eastern Asian and Pacific economies featured constantly throughout 20 editions, the region has improved parity in this subindex more than others, gaining +9 percentage points from 62.2% in 2006 to 71.3% in 2026. This long-term improvement has been driven by substantial advances in economic representation: parity among legislators, senior officials and managers has more than doubled from 20.6% to 49.4%, while parity among professional and technical workers has increased from 81.7% to 98.3%.
Educational Attainment sees gender parity reach 98.5% in 2026 – the fifth-highest regional score (Figure 1.8). The region records its largest annual improvement in this subindex, increasing parity by +3.3 percentage points. This change primarily reflects updated secondary education enrolment data for populous economies, contributing to an increase of nearly 8 percentage points for this indicator since the previous edition. However, when accounting for all economies covered since 2006, the region has made particularly strong progress in tertiary education enrolment, adding +14.4 percentage points to its gender parity score since 2006 and virtually closing the gap in this indicator, reaching 99.6% in 2026.
The region records a Health and Survival score of 95.6% (Figure 1.8). Health outcomes remain broadly stable and have little impact in the region’s overall performance.
In Political Empowerment, Eastern Asia and the Pacific is position at the lower half of the regional ranking, having closed 15.5% of the political parity gap (Figure 1.8). The region has shown very modest gains since 2006 in this dimension, with a wide range of results at the individual economy level slowing down regional pace of progress. Despite the slow pace, the region has advanced at the aggregate level in political representation. Gender parity in parliament, for one, has climbed steadily across editions to 33.9% in 2026, gaining a total of +12.3 percentage points over time. Ministerial parity has also increased, albeit modestly, from 9.7% to 12.9%. Where the region has seen parity regress is at the head-of-state level. From an initial starting score of 4.8%, the region saw its scores peak between 2017–2019 at 9%, only to decline to 4.3% in 2026.
Europe
In 2026, Europe has closed 75.7% of its overall gender gap (Figure 1.7). The region reclaims from Northern America the top regional rank after recording a +0.6 percentage-point increase in score since the last edition. When the index was first launched, Europe ranked second in overall gender parity, behind Northern America. Since then, it has narrowed its gender gap by 7 percentage points, the second-largest improvement across regions by 2026. Relative to other regions, Europe’s continuing advance towards parity places it second in line to close the gap within a 70-year timeframe, a decade after Latin America and the Caribbean (60 years) (Figure 1.9).
Approximately 40 economies comprise the region in 2026, seven of which feature among the current global top 10 performers. Europe is also the only region to have multiple economies appear consecutively in the global top 10 across every edition of the index: Iceland, Finland, Norway and Sweden. While only Iceland has closed more than 90% of the gender gap, approximately 95% of the region’s economies have scores above 70%. Nevertheless, score dispersion remains evident, with the bottom two performers, Türkiye and Romania, standing more than 20 percentage points below Iceland.
Europe ranks fifth in Economic Participation and Opportunity, having closed 69.5% of the economic gender gap (Figure 1.9). When accounting for all the economies covered since the index was launched, Europe has seen parity score in workforce participation and perceived wage equality for similar work increase by +8.4 percentage points over the two decades. Furthermore, parity in representation in economic senior leadership has increased substantially, from 36.9% in 2006 to 52.9% in 2026. Parity among professional and technical workers also registered a double-digit improvement of +13.1 percentage points, bringing the region’s score for this indicator from 83.4% in 2006 to 96.5% in 2026.
In Educational Attainment, Europe ranks third (Figure 1.9). It stands alongside Latin America and the Caribbean and Central Asia as one of three regions that remain less than one percentage point from closing the educational gender gap. Across this dimension, Europe has improved secondary and tertiary education scores the most, bringing the gap in both indicators to less than 2% from full parity.
The region records a gender parity score of 96.9% in Health and Survival, placing fourth behind Latin America and the Caribbean, Central Asia, and Northern America (Figure 1.9). While overall health parity remains high, parity in healthy life expectancy has been declining over time.
Europe leads all regions in Political Empowerment, with a parity score of 37%, making it one of only two regions that have closed more than one-third of the political gender gap, alongside Latin America and the Caribbean (Figure 1.9). Since the last edition, gender parity parliamentary representation has declined from 53.5% to 51%. In contrast, ministerial representation improved by +1.3 percentage points, reaching 57.7%, while parity at the head-of-state level increased by +0.4 percentage points. Over the longer term, however, all political indicators have followed an overwhelmingly positive trajectory. Parity for women at the highest levels of political representation has tripled since the index was first launched, from 5.4% in 2006 to 16.6% in 2026.
Latin America and the Caribbean
In the 20th edition of the index, Latin America and the Caribbean retained both its overall rank (3rd) and overall score (74.5%) from last year (Figure 1.7). Although the region remains behind Europe and Northern America in overall score, it has maintained a consistently positive trajectory over time that gives it the fastest estimated timeframe to parity, at 60 years, a decade earlier than Europe (70 years) and almost half a century before Sub-Saharan Africa (102 years) (Figure 1.9).
The 22 economies that comprise this regional block show a high level of convergence in overall gender parity. While no economy in the region has a score above 80%, none score below 70% either. This relatively cohesive pace of progress has enabled Latin America and the Caribbean to record the largest improvement of any region since the Index was first launched. By narrowing its overall gender gap by 8.6 percentage points, the region has more than doubled the progress achieved by Eastern Asia and the Pacific and Middle East and Northern Africa (4.2 percentage points each) and tripled that of Central Asia (2.9 percentage points).
In Economic Participation and Opportunity, Latin America and the Caribbean has closed 66.4% of the economic gender gap (Figure 1.8). At the individual economy level, however, performance varies considerably: with scores of 84.8% and 61.8%, Barbados and Mexico, the region’s highest- and lowest-performing economies in this subindex, are separated by a 23 percentage-point spread. Long-term improvements in workforce representation underpin this progress. Since 2006, the region has narrowed the gender gap in Economic Participation and Opportunity by 10.6 percentage points. Parity has increased by 9.6 percentage points among professional and technical workers, reaching 98.2%, and by 17.7 percentage points among legislators, senior officials and managers, reaching 64.2%. Parity in estimated earned income has also improved by more than 20 percentage points across editions, from 40.2% in 2006 to 62.5% in 2026. Despite these gains, progress in labour-force participation has been more modest, with the workforce parity score increasing by 5 percentage points, fluctuating between 64.7% in 2006 and a high of 71.3% in 2021.
In Educational Attainment, Latin America and the Caribbean records the second-highest regional parity score, at 99.6%, behind only Northern America (100%) (Figure 1.8). Ten of the region’s 22 economies have achieved parity in this dimension, while the remaining 12 are all within 3 percentage points of doing so. Over time, the region has reduced disparities in primary and tertiary enrolment by 2.4 percentage points each, reaching virtual parity in both indicators. Adult literacy differences between women and men are virtually absent in half of the region’s economies, and the regional literacy score has improved by 1.3 percentage points since 2006 to reach 98.8% in 2026.
In Health and Survival, economies in the region have closed 97.7% of the health gap (Figure 1.8). This places Latin America and the Caribbean at the top of the regional rankings, ahead of Central Asia (97.3%) and Northern America (97.2%). Similar to its overall performance, economies in the region are tightly clustered in this subindex, with most scores falling within 1.5 percentage points of one another.
With a Political Empowerment score of 34.2%, Latin America and the Caribbean ranks second only to Europe (Figure 1.8). Beneath the regional average, however, lies substantial heterogeneity. Mexico (55.7%) records the 8th-highest subindex score globally, while Belize’s score of 5.9% places it among the ten lowest in the subindex. Despite these differences, the region has made substantial progress in political representation over the past two decades. Ministerial parity has more than tripled since 2006, increasing by 42.1 percentage points from 17.8% to 60%. Parliamentary parity has more than doubled, rising from 22.8% to 53.7%. While head-of-state parity remains lower than in Southern Asia (41.3%) and Europe (16.6%), it has nevertheless increased by 8.2 percentage points over time, reaching 8.7% in 2026.
Middle East and Northern Africa
In 2026, Middle East and Northern Africa achieves a 62.5% gender parity score, improving by +0.2 percentage points from the last edition. Despite this progress, it closes the regional ranking table
in 8th place (Figure 1.7).
Fourteen economies are included in the regional block in 2026, and two of these rank in the global top 100: Israel (71.7%, 71st) and the United Arab Emirates (70.2%, 91st). Individual performances stretch across a 13.1 percentage-point range, with the lowest score posted by Iran (Islamic Republic of) (58.5%, 144th). While starting from a comparatively low baseline, Middle East and Northern Africa has consistently moved closer to parity over time with little reversal. Over the course of 20 editions, it has reduced its overall gender gap by 4.2 percentage points, and is estimated to close the gap seventh, in 182 years (Figure 1.9).
In Economic Participation and Opportunity, Middle East and Northern Africa has closed 44.8% of the gap (Figure 1.8). It ranks 7th, ahead of Southern Asia (40.9%). Female representation across workforce categories has improved over time, pushing gender parity among professional and technical workers up by +14.9 percentage points and by +6.2 percentage points among legislators, senior officials and managers. Despite these gains, Middle East and Northern Africa has registered a decline in labour-force participation parity, from 38.5% in 2006 to 32.2% in 2026.
In Educational Attainment, Middle East and Northern Africa has reduced the educational gap to less than 3%, with a 2026 score of 97.8% (Figure 1.8). positioning the region ahead of Southern Asia (95.9%) and Sub-Saharan Africa (89.5%). Over time, the region has reached parity in two of the four indicators: primary and tertiary education enrolment. The region has also reduced the gender gap in adult literacy by a total of 12.5 percentage points, while parity in secondary education enrolment has increased by 4 percentage points, bringing the region to virtual parity (99.2%).
In Health and Survival, Middle East and Northern Africa records a gender parity score of 96.2% (Figure 1.8). The region ranks sixth, behind Europe (96.9%) and Sub-Saharan Africa (96.8%), and ahead of Southern Asia (95.7%) and Eastern Asia and the Pacific (95.6%).
Political Empowerment remains the region’s weakest-performing dimension, with a parity score of 11.5%, the lowest of all regions (Figure 1.8). The region records the fifth-highest parity score for ministerial representation (16.4%) and the seventh-highest for parliamentary representation (23.9%) in 2026. The widest political gender gap remains at the head-of-state level, where the regional parity score is 0% in 2026.
Northern America
Northern America closes 75.2% of its overall gender gap in 2026, placing 2nd among the eight regions (Figure 1.7). Compared with last year, the region’s score declines by 0.6 percentage points, allowing Europe to reclaim the top regional position. This shift reflects diverging trends between its two constituent economies with Canada’s score improving from 76.7% to 77.7% and the United States score declining from 75.6% to 74.9%.
Northern America entered the inaugural 2006 edition as the only region to have surpassed the 70% parity threshold, with 70.5% of its gender gap closed, and remained the global leader through 2015. Since then, however, progress has been more gradual. At its current pace, the region is projected to close its remaining gender gap in 108 years, ranking fourth behind Latin America and the Caribbean (60 years), Europe (70 years) and Sub-Saharan Africa (102 years) (Figure 1.9).
The region continues to lead the world in Economic Participation and Opportunity, with 77.1% of the gap closed (Figure 1.8). The score improves by 1 percentage point from last year and by 1.6 percentage points since 2006. Full parity has been maintained among professional and technical workers throughout the history of the index, while perceived wage equality, estimated earned income and labour-force participation have all improved. By contrast, parity among legislators, senior officials and managers has declined by 7.4 percentage points since 2006, including a slight drop from 75.0% to 74.4% between 2025 and 2026.
Educational Attainment remains Northern America’s strongest dimension. The region has held 1st place since 2019, maintaining full parity after entering the inaugural edition with an already high score of 98.3%.
Northern America ranks 3rd in Health and Survival, with 97.2% of the gap closed (Figure 1.8). Health outcomes have changed little over time. The sex ratio at birth has remained close to parity, while healthy life expectancy parity has gradually declined as healthy life expectancy has fallen for both women and men, with a steeper decline among women.
With 26.4% of the gap closed, Northern America ranks 3rd in Political Empowerment (Figure 1.8). The score falls by 3.3 percentage points this year, driven primarily by a 13.2 percentage-point decline in women’s representation in ministerial positions, alongside a marginal decline in parliamentary representation. Despite this reversal, Northern America has narrowed its political gender gap by 16.1 percentage points since 2006, with substantial gains in both parliamentary (+22.1 percentage points) and ministerial (+37.3 percentage points) representation.
Southern Asia
Southern Asia closes 64.5% of its overall gender gap in 2026, placing 7th among the eight regions (Figure 1.7). The regional score declines marginally by 0.1 percentage points from last year, while its ranking remains unchanged.
Since the inaugural edition of the index, Southern Asia has narrowed its gender gap by 4.8 percentage points. While this represents steady progress, it has been slower than in most other regions. At its current pace, Southern Asia is projected to reach full gender parity in 149 years, placing sixth in line to close the gap (Figure 1.9).
The region performs the weakest in Economic Participation and Opportunity subindex, with 40.9% of the gap closed to date (Figure 1.8). The score improves by 0.3 percentage points from last year and by 1.0 percentage point since 2006. Over the past two decades, the largest gains have come from parity in representation in professional and technical occupations (+18.7 percentage points) and among legislators, senior officials and managers (+8.1 percentage points). Even so, both indicators remain the lowest of any region. By contrast, parity in labour-market outcomes has deteriorated over time, with declines in both perceived wage equality (-4.3 percentage points) and estimated earned income (-5.0 percentage points), while labour-force participation has remained broadly unchanged.
The region’s Educational Attainment subindex ranks 7th, with 95.9% of the gap closed (Figure 1.8). Southern Asia records the largest improvement of any region since 2006, increasing its score by 15.0 percentage points, including a 0.5-percentage-point gain this year. Much of this progress was achieved during the first decade of the index. Tertiary enrolment has improved the most, gaining 31.8 percentage points since 2006, and almost all economies have now reached parity. The region has also made substantial advances in secondary enrolment (+18.8 percentage points), adult literacy (+18.0 percentage points) and primary enrolment (+7.5 percentage points). Despite these gains, only Maldives has achieved parity in adult literacy.
Southern Asia ranks 7th in Health and Survival, with 95.7% of the gap closed (Figure 1.8). The score improves slightly this year, driven by higher parity in the sex ratio at birth, while healthy life expectancy remains broadly unchanged. Over the longer term, however, the region has seen a modest decline in this subindex, reflecting lower parity in the sex ratio at birth despite improvements in healthy life expectancy.
With 25.4% of the gap closed, Southern Asia ranks 4th in Political Empowerment (Figure 1.8). The parity score declines by 1.4 percentage points from last year, largely reflecting developments in Bangladesh, where the dissolution of parliament in 2025 was followed by the formation of a new parliament with women holding 2.4% of seats. Since 2006, the region has narrowed its political gender gap by 3.5 percentage points, recording the slowest progress of any region. Over this period, parity has increased by 4.8 percentage points in parliamentary representation, 3.0 percentage points in ministerial representation and 2.9 percentage points in the share of years with a female head of state.
Sub-Saharan Africa
Sub-Saharan Africa closes 68.8% of its overall gender gap in 2026, placing 6th among the eight regions (Figure 1.7). No other region displays as wide a range of outcomes. Namibia ranks 4th globally with 84.5% of its gender gap closed, while Chad records the lowest score in the Index at 57.8%. Compared with last year, the regional score increases by 1.6 percentage points, although its position in the regional ranking remains unchanged.
Since the index was first launched, Sub-Saharan Africa has narrowed its overall gender gap by 6.0 percentage points. At its current pace, the region is projected to reach full gender parity in 102 years, placing third behind Latin America and the Caribbean and Europe.
In Economic Participation and Opportunity, the region has closed 70.6% of its gender gap, ranking 4th globally (Figure 1.9). The score improves by 1.0 percentage point from last year and by 8.0 percentage points since 2006. Much of this progress reflects stronger representation among legislators, senior officials and managers, where parity has increased by 28.7 percentage points over two decades. Labour-force participation (+18.7 percentage points), estimated earned income (+16.4 percentage points), and representation among professional and technical workers (+6.8 percentage points) have also improved substantially. By contrast, perceived wage equality has declined by 10.1 percentage points since 2006.
Educational Attainment remains the region’s weakest-performing subindex, despite recording the largest annual improvement of any dimension (Figure 1.8). The regional score rises by 5.8 percentage points this year to reach 89.5%, bringing the cumulative gain since 2006 to 10.3 percentage points. Tertiary enrolment has improved the most, with parity increasing by 28.1 percentage points since 2006. Strong gains have also been recorded in secondary enrolment (+14.4 percentage points), primary enrolment (+5.1 percentage points) and literacy (+4.7 percentage points).
Sub-Saharan Africa ranks 4th in Health and Survival, with 96.8% of the gap closed (Figure 1.8). The regional score is broadly unchanged from last year and remains close to its 2006 level. While parity in the sex ratio at birth has remained close to its benchmark, healthy life expectancy parity has declined over time as life expectancy has improved more rapidly for men than for women in several economies, including Burkina Faso, Chad, Madagascar, Mali, Nigeria, South Africa and the United Republic of Tanzania.
Political Empowerment places Sub-Saharan Africa 5th among the eight regions, with 18.1% of the gap closed (Figure 1.8). The score declines slightly from last year but remains 6 percentage points above its 2006 level. Progress over the past two decades has been driven by gains in parliamentary representation (+11.6 percentage points), ministerial representation (+6.9 percentage points) and the share of years with a female head of state (+1.7 percentage points).
In-focus country performances: Top 10 and most populous
Top 10 economies
Iceland
Iceland ranks 1st in the 2026 Global Gender Gap Index, with 93.0% of its gender gap closed. Compared with the 2025 edition, its overall parity score increased by +0.5 percentage points and is now 14.9 percentage points higher than in the inaugural 2006 edition. Iceland has demonstrated a consistently positive trajectory towards gender parity over the past two decades, remaining in the global top 10 throughout the period and holding the top position since the 2009 edition.
The economy has closed 81.6% of its gender gap in Economic Participation and Opportunity, an increase of 1.8 percentage points since the 2025 edition and 10.5 percentage points since 2006, from 71.1%. Over the past 20 editions, parity has improved across most indicators. Labour-force participation increased by 4.4 percentage points to 91%, the economy has maintained full parity in the representation of professional and technical workers, and parity among legislators, senior officials and managers has risen by 28.0 percentage points. Perceived wage equality for similar work also improved substantially, increasing by 19.4 percentage points, while parity in estimated earned income declined slightly, by 2.2 percentage points.
In Educational Attainment, Iceland has maintained near parity score since 2006. The economy has achieved full parity in adult literacy and tertiary education enrolment since 2006, while primary and secondary education enrolment have consistently remained close to parity, with scores above 95% throughout the period.
In Health and Survival, Iceland has closed 96.1% of its gender gap in the 2026 edition and has maintained near-full parity at the subindex level throughout the 20 editions. Although the sex ratio at birth has fluctuated slightly over time, parity has remained at its benchmark. Healthy life expectancy has declined modestly since the pre-pandemic period, reflecting reductions in healthy life expectancy for both women and men, with a faster decline among women.
Iceland continues to lead the world in Political Empowerment, with a parity score of 95.4%, remaining the only economy to have closed more than 90% of its gender gap in this subindex. Its parity score has more than doubled since 2006, rising from 45.6% to 95.4% in 2026. The economy has achieved full parity in ministerial positions since 2024 as well as years with a female head of state since 2023. Parliamentary representation also remains among the highest globally, with a parity score of 85.3%, slightly below its record high of 90.8%.
Finland
Finland ranks 2nd in the 2026 Global Gender Gap Index, having closed 87.2% of its overall gender gap. Compared with the 2025 edition, its overall parity score declined by 0.6 percentage points, while its global ranking remained unchanged, at 2nd place. Since the launch of the index in 2006, Finland has consistently ranked among the global top five and has improved its overall parity score by 7.7 percentage points over the past two decades.
Finland has closed 79.1% of its gender gap in Economic Participation and Opportunity, a decline of 2.5 percentage points from the 2025 edition, reflecting lower parity across all underlying indicators except professional and technical workers. Since 2006, the economy has improved its Economic Participation and Opportunity subindex score by 5.7 percentage points, up from 73.4%, with most gains achieved between 2006 and 2015. Since then, the subindex score has fluctuated, reflecting differing trends across the underlying indicators. Finland has maintained full parity among professional and technical workers throughout the period and has made steady progress in the share of women among legislators, senior officials and managers, increasing parity from 38.9% in 2006 to 55.4% in 2026. Labour-force participation parity improved from 86.3% in 2006 to 89.9% in 2026, although it has yet to recover to its pre-pandemic level of above 95%. Parity in estimated earned income stands slightly above its 2006 level (73.5% in 2026, compared with 72% in 2006). Meanwhile, parity in perceived wage equality for similar work increased steadily from 72.3% in 2006 to 80.5% in 2015 and has remained broadly stable at around 80% since then.
Finland achieves full parity in Educational Attainment in the 2026 edition. The economy has maintained full parity in adult literacy and enrolment in secondary and tertiary education since 2006, while parity in primary education enrolment has consistently remained above 98% over the past 20 editions.
In Health and Survival, Finland has closed 97.1% of its gender gap in the 2026 edition. The economy has maintained full parity in sex ratio at birth throughout the history of the index. Healthy life expectancy has declined modestly since the pre-pandemic period, driven by a slight increase in healthy life expectancy for men alongside a decline for women. Healthy life expectancy in Finland stood at 73.5 years for women and 68.7 years for men in the 2006 edition, compared with 71 years for women and 68.8 years for men in the 2026 edition.
Finland has closed 72.8% of its gender gap in Political Empowerment, ranking second globally behind Iceland (95.4%) in the 2026 edition. Since 2006, the economy has improved its Political Empowerment score by 25.8 percentage points. Over this period, parity among parliamentarians increased by 22.2 percentage points, from 61.3% to 83.5%; parity in ministerial positions rose by 11 percentage points, from 89% to full parity; and parity in years with a female head of state increased by 36.6 percentage points, from 13.6% to 50.3%.
Norway
Norway ranks 3rd in the 2026 Global Gender Gap Index, having closed 85.7% of its overall gender gap. Compared with the 2025 edition, its overall parity score declined by 0.6 percentage points, while its global ranking remained unchanged at third place. Since the launch of the index in 2006, Norway has consistently ranked among the global top three and has improved its overall parity score by 5.8 percentage points over the past two decades.
In Economic Participation and Opportunity, Norway has closed 76.9% of its gender gap, a decline of 0.8 percentage points from the 2025 edition, reflecting lower parity across the economic outcomes indicators and labour-force participation. Since 2006, the economy has improved its Economic Participation and Opportunity score by 4.0 percentage points, from 72.9%. The subindex reached its highest level in 2015, at 86.8%, before gradually declining, although it remains above its 2006 level. This pattern is largely driven by changes in economic outcomes and representation in senior positions. Parity in estimated earned income increased from 74.8% in 2006 to full parity in 2010-2015 before declining to 68.9% in 2026. Similarly, parity in perceived wage equality for similar work rose from 65.9% in 2006 to 82.3% in 2015 and has since fallen to 77.5%. Parity among legislators, senior officials and managers improved from 42.9% in 2006 to a peak of 62.1% in 2018 before declining to 52.3% in 2026. Norway has maintained full parity among professional and technical workers in nearly every edition of the Index. Labour-force participation parity has remained broadly stable, increasing slightly from 87.2% in 2006 to 89.0% in 2026, but has yet to recover to its pre-pandemic level of just under 95%.
Norway scores 99.7% in Educational Attainment in the 2026 edition, with secondary education enrolment remaining the only indicator displaying a small gender gap. The economy has maintained full parity in adult literacy and tertiary education enrolment since 2006, while parity in primary education enrolment has consistently remained above 98% throughout the past 20 editions. The remaining gap in secondary enrolment reflects a higher share of boys than girls enrolled outside the official age range for secondary education, which may be associated with higher rates of grade repetition among boys. Although the gap is small, it has narrowed in recent years as boys’ enrolment has moved closer to parity with girls.
In Health and Survival, Norway has closed 96.0% of its gender gap in the 2026 edition. The economy has maintained near-full parity in the sex ratio at birth throughout the history of the index. Healthy life expectancy has declined modestly since the pre-pandemic period, reflecting reductions for both women and men, with a more pronounced decline among women.
In Political Empowerment, Norway has closed 70.4% of its gender gap, ranking third globally in the 2026 edition. Since 2006, the economy has improved its Political Empowerment score by 20.9 percentage points. Over this period, the greatest sustained progress has been in the indicator measuring years with a female head of state, where parity more than doubled from 24.4% in 2006 to 56.7% in 2026. Parliamentary representation also improved markedly, with parity rising from 61.0% in 2006 to a peak of 85.9% in 2023, before declining to 74.2% in 2026. Parity in ministerial positions reached full parity between 2008 and 2013, declined in subsequent years, recovered to full parity in 2023 and 2024, and dropped to 90.0% in the 2025 and 2026 editions.
Namibia
Namibia ranks 4th in the 2026 Global Gender Gap Index, having closed 84.5% of its overall gender gap. This marks the highest ranking the economy has achieved since the launch of the index in 2006. Compared with the 2025 edition, its overall parity score increased by 3.4 percentage points, while its global ranking improved by four places. Over the past 20 editions, Namibia has ranked among the global top 10 seven times and has improved its overall parity score by 15.9 percentage points.
In Economic Participation and Opportunity, Namibia has closed 80% of its gender gap, an increase of 0.3 percentage points from the 2025 edition. Since 2006, the economy has improved its Economic Participation and Opportunity score by 18.6 percentage points, from 61.4%. While some of the underlying indicators draw on data that do not fully reflect the most recent labour-market conditions, the economy has recorded substantial long-term progress across several dimensions. Labour-force participation parity increased by 14.1 percentage points, from 74.3% in 2006 to 88.4% in 2026. Parity among legislators, senior officials and managers rose by 34.3 percentage points, from 42.9% to 77.2%, while parity in estimated earned income increased by 32.5 percentage points, from 51.0% to 83.5%. Perceived wage equality for similar work also improved, rising from 54.1% in 2006 to 65.4% in 2026. Namibia has maintained full parity among professional and technical workers throughout the history of the index.
Namibia scores 99.8% in Educational Attainment in the 2026 edition, achieving full parity in secondary and tertiary education enrolment, with only a small remaining gap in adult literacy. The economy has maintained full parity in secondary and tertiary enrolment in almost every edition since 2006. Parity in adult literacy improved from 96.2% in 2006 to 99.4% in 2026, despite minor fluctuations over time.
In Health and Survival, Namibia has maintained full parity at the subindex level (98.0%) since the 2014 edition. The economy has sustained near-full parity in sex ratio at birth throughout the history of the index. Over the past two decades, healthy life expectancy has increased for both women and men. However, the COVID-19 pandemic reduced healthy life expectancy more for women than for men, although overall parity in the subindex has been maintained.
Namibia has made significant progress in Political Empowerment over the past two editions, with its parity score increasing from 46.7% to 60.3%. The economy ranks 7th globally and 1st in Sub-Saharan Africa on this subindex. Following the inauguration of President Netumbo Nandi-Ndaitwah on 21 March 2025, Namibia recorded its highest parity score for the head-of-state indicator over the past 20 editions, at 29%. At the same time, the economy achieved full parity in ministerial positions for the first time, up from a parity score of 58.3% in the 2025 edition. Since 2006, Namibia’s Political Empowerment score has more than tripled, rising from 17.2% to 60.3%. Over this period, parity in years with a female head of state increased from 0% to 29%, parity in ministerial positions rose from 23.5% to full parity, and parity in parliamentary representation increased from 36.8% to 73.3%, although this remains below its peak of 85.7% recorded between the 2018 and 2019 editions.
United Kingdom
The United Kingdom ranks 5th in the 2026 Global Gender Gap Index, having closed 84.2% of its overall gender gap. Compared with the 2025 edition, its overall parity score increased by 0.4 percentage points, while its global ranking declined by one place. Over the past 20 editions, this is the third time the United Kingdom has ranked among the global top 10, and its overall parity score has improved by 10.6 percentage points.
In Economic Participation and Opportunity, the United Kingdom has closed 75.9% of its gender gap, an increase of 1.4 percentage points from the 2025 edition. This improvement reflects gains in labour-force participation (+1.6 percentage points), estimated earned income (+5.3 percentage points), and the parity among legislators, senior officials and managers (+1.4 percentage points), partially offset by a slight decline in perceived wage equality for similar work (-0.8 percentage points). Since 2006, the economy has improved its Economic Participation and Opportunity score by 9.4 percentage points, from 66.4%. Over the past two decades, the United Kingdom has recorded steady progress across all three indicators measuring labour-market representation. Parity in labour-force participation increased from 79.7% in 2006 to 89% in 2026; parity among professional and technical workers rose from 82% to full parity; and parity among legislators, senior officials and managers increased from 49.3% to 68.7%. The indicators measuring economic outcomes have also improved compared with their 2006 levels, although both remain below their historical peaks. Parity in estimated earned income increased from 61.7% in 2006 to 68.5% in 2026, after exceeding 70% in the early 2010s. Similarly, parity in perceived wage equality for similar work rose from 63.3% in 2006 to 66.7% in 2026, compared with its peak of 71% in the 2022 edition.
The United Kingdom has maintained full parity in Educational Attainment in the 2026 edition and has achieved full parity in almost every edition since 2006.
In Health and Survival, the United Kingdom has closed 96.5% of its gender gap in the 2026 edition, unchanged from the 2025 edition. Over the past 20 editions, the healthy life expectancy parity score has declined by 3.1 percentage points. Before the COVID-19 pandemic, healthy life expectancy increased slightly for men while declining for women. During the pandemic period, healthy life expectancy declined for both women and men, although women continue to enjoy a longer healthy life expectancy than men.
In Political Empowerment, the United Kingdom has closed 64.6% of its gender gap in the 2026 edition, an improvement of 0.3 percentage points from the 2025 edition. Since 2006, the economy has more than doubled its Political Empowerment score, rising from 30.7% to 64.6%. Over this period, parity in years with a female head of state increased from 29.9% to 41.8%. The economy achieved full parity in ministerial positions for the first time in the 2025 edition and maintained it in 2026, up from 40.1% in 2006 after reaching 50.0% in the 2023 and 2024 editions. Parliamentary representation has also followed a sustained upward trajectory, with parity increasing from 24.5% in 2006 to 68.8% in 2026.
New Zealand
In 2026, New Zealand ranks 6th, with a score of 82.8%, as well as first in its regional block. Despite the +0.1 percentage-point improvement in score, the economy dropped one rank since last edition. Since the launch of the index, New Zealand has featured 19 times among the top 10 performers. It has also reduced its overall gender gap by 7.7 percentage points, from 75.1% in 2006 to 82.8% in 2026.
Having closed 73.5% of the Economic Participation and Opportunity gap, New Zealand is the ninth-best performer from Eastern Asia and the Pacific in this subindex. Since 2006, New Zealand reduced its overall economic parity gap by 2 percentage points. However, since the last edition, the pacific nation saw a decline in score (-0.3 percentage points) and a drop in overall rank (-6) places) from the last edition. In 2026, New Zealand saw a relative increase in parity in labour-force participation rate (+1 percentage point), due to a higher reduction of men’s workforce participation rate compared to women’s. However, the absence of workforce representation data shifted index weight to the economy’s score reduction in wage equality for similar work (-2.1 percentage points), negatively impacting its overall subindex performance.
In Educational Attainment, New Zealand has retained near to full parity since 2006 at the subindex level. Since the last edition, it has also conserved full parity across indicators, as well as the top rank overall and within its region. Although the headline result is unchanged, enrolment patterns continue to evolve. While overall educational parity remains unchanged, the underlying dynamics differ by level of education. In secondary education, women’s enrolment increased slightly more than men’s, reinforcing their dominant representation at this level. In tertiary education, however, men’s enrolment increasing more compared to women’s, narrowing women’s overrepresentation in this tier.
In Health and Survival, New Zealand maintains its score and achieves a relative rank improvement, despite no major shifts occurring internally.
In Political Empowerment, New Zealand leads the Eastern Asia and the Pacific regional group, after nearly doubling its 2006 political parity score from 31.7% to 61.3% in 2026. Compared to the last edition, a slight increase in women’s representation in parliament increases the gender parity score for the indicator to 86.4% and propels New Zealand’s performance in this subindex to 6th overall. At the ministerial level, New Zealand retains the same gender distribution within the cabinet and, consequently, the same level of parity as the last edition (53.8%). Its parity score for head of state also remains unchanged since the past four editions, at 48%.
Sweden
In the 2026 of the index, Sweden makes its 20th consecutive appearance in the top 10 after placing 7th overall, with a gender parity score of 82.3%. Within Europe, this places Sweden in the 5th position. However, Sweden’s consistently high ranking reflects a strong starting position rather than continued gains. Compared to the last edition, Sweden improved its score by +0.6 percentage points. But its initial gender parity score of 81.3% increased by +1 percentage point since 2006, leaving Sweden with a mostly flat, two-decade trajectory.
Sweden’s gender parity efforts are slightly more dynamic in Economic Participation and Opportunity. Its 2026 score of 82.4% ranks it 7th overall, and 1st in its region, registering a +9.3 percentage-point improvement since 2006 (73.1%). Parity shifted in senior workforce representation since the last edition, upping the parity score for legislators, senior officials and managers from 77.5% in 2025 to 80% in 2026. This indicator is also one of the few where Sweden registers absolute gains in parity, up +37.2 percentage points from 42.9% in 2006. Sweden has maintained full parity in professional and technical workers since 2006, and increased parity in labour-force participation rate gradually over two decades, the most recent annual push increasing its 2025 91.2% score to 91.8% in 2026.
In Educational Attainment, Sweden is among the economies ranked first with a 100% parity score overall and within Europe. In the 20 years the economy has been indexed, it has recorded parity or near-parity scores across nearly all educational indicators. As a result, variation in this subindex has been minimal.
Sweden registers a 96.2% score in Health and Survival in 2026. Placed within the lowest 10 performers in this subindex in Europe, this is the sole subindex where Sweden diverges from leading economies. Over time, its sex ratio at birth score has moved marginally upwards to meet the 94.4% parity cap. In turn, parity in healthy life expectancy has decreased gradually a total of -3.8 percentage points.
In Political Empowerment, the Nordic economy ranks 13th, having closed 50.6% of its political gender gap. While Sweden’s overall parity score sits within the highest overall and top 8 in Europe, it lags significantly from the top score of Iceland (95.4%). Sweden has maintained its parity score for head of state for four editions running at 1.8%. In contrast, it is one of the few economies where parity at ministerial level has been above 80% since 2006. In 2026, the score for the indicator is 100%, slightly up from the 2025 edition score of 91.7%. For women in parliament, Sweden records a score of 80.8%, a -0.9 percentage-point drop from 2025 (81.8%). This constitutes a second consecutive reduction in score since 2024 (87.6%) and begins to sketch a second downturn in the economy’s twenty-year trajectory in this indicator, which originally benchmarked a parity score of 89.8% in 2006.
Australia
Making its debut in the top 10 group as the 8th best performer in 2026, Australia achieves a gender parity score of 81.9%. This makes Australia the second-best performer from Eastern Asia and the Pacific, behind New Zealand (82.8%, 6th). The Australian economy improved its level of parity compared to the last edition by +2.7 percentage points from 79.2%, passing the 80% gap threshold where top performers cluster. Australia’s recent performance follows a clear inflection point: consecutive gains since 2023 have lifted what had previously been a largely flat trajectory.
In Economic Participation and Opportunity, Australia ranks among the top 20 overall and 4th in Eastern Asia and the Pacific, having closed 77.9% of its economic gap. Australia sees a slight improvement in the economic rewards categories. Perceived wage equality improved since last edition, and absolute parity gains in estimated earned income also rose from 64.3% to 65.2% in 2026. While this spells good news, it is worth noting that parity in estimated earned income has not recovered to 2006 levels (72.1%). Parity in labour-market participation did not change from the last edition; the Pacific economy has made the most headway in this indicator over time (+8.8. percentage points). Since the index was launched, parity increased in labour-force participation rate from 79.9% in 2006 to 88.6% in 2026 – nearly recovering its peak level of 2021 (88.7%).
In Educational Attainment, Australia scores 99.1% in 2026, slightly improving its score from last edition, but falling short of its full parity standing as posted in the 2006–2021 editions. Within its regional block, Australia sits in the midpoint of the performance table. Australia has seen an absolute decline in parity for Educational Attainment over the past two decades, of -0.9 percentage points. With most economies clustering near parity in this dimension, small regressions can have an outsized impact on an economy’s performance. In Australia’s case, parity in secondary education enrolment dropped initially in 2022 (93.4%) and has only partially recovered since.
In Health and Survival, Australia scores 96.5%, which places it amidst the lower-middle range performers of the Eastern Asia and the Pacific region. In this subindex the economy has seen little variation over time in sex ratio at birth. However, in healthy life expectancy, Australia joins a broader group of economies where parity has been progressively declining over time.
Australia continues to register year-on-year improvements in Political Empowerment. From last edition, the economy boosted its 45.8% political parity score to 53.9%, an +8.2 percentage-point improvement since 2025. Over time, Australia has narrowed its political gap by +37.6 percentage points, more than tripling its initial 2006 score of 16.3%. While the economy has not had a second woman head of state since 2013, it has seen political representation improve significantly in the two remaining indicators. In 2026, Australia reaches full parity at ministerial level, up +6.7 percentage points from 2025, and adds +21.1 percentage points to parliamentary parity (85.2% in 2026).
Germany
Germany ranks 9th in the Global Gender Gap Index 2026, with a gender parity score of 81.7%. Over the past two decades, Germany has made the top 10 on eight occasions. Within Europe, the economy is the sixth-highest ranked in this edition. Compared with the last edition, Germany advanced parity by +1.3 percentage points, from 80.3%. This represents nearly one fifth of Germany’s overall gains over time, which amounts to +6.4 percentage points since its initial index score of 75.2%.
In Economic Participation and Opportunity, Germany scores 69.6%, which positions it just below the middle of the global ranking, in 80th place. This placement carries over to its regional block, where Germany stands in 29th position out of 40. Since the last edition, Germany registered a positive +1.7 percentage point increase in economic parity, adding to an overall twenty-year positive trend, narrowing its initial gap of 66.9% by 2.7 percentage points. Since 2015, Germany has retained full parity among professional and technical workers. While Germany saw an increase from last edition’s parity score in legislator, senior officials and managers – from 40.1% to 43.4% – the overall trajectory in this indicator has been negative, dropping -12.8 percentage points from 56.3% in 2006. In comparison, the gender gap in labour-force participation rate has been reduced by eight percentage points since 2006. While Germany has not yet recovered to 2021 levels (89.7%), it has posted increasing scores since 2023.
In Educational Attainment, Germany records a score of 98.9%, ranking 88th overall and 36th in Europe. The economy has achieved full parity in adult literacy, primary education enrolment, and tertiary education enrolment, and shows little variation over time in this subindex. Educational parity is held back only by comparatively decreasing parity scores in secondary education enrolment, from 98% in 2006 to 95.2% in 2026. In the German context, male students are overrepresented in secondary education enrolments compared to female students, even if both groups have increased their share over time.
In Health and Survival, Germany scores 96.6%, placing 91st overall and 25th within Europe. The economy has seen parity marginally increase over time in the sex ratio at birth, by +0.1 percentage point from 2006. Parity in healthy life expectancy, however, has decreased over time like in many other European economies.
Germany records a Political Empowerment score of 61.6%, ranking 5th overall and within Europe. In 2026, the economy has achieved full parity at the ministerial level, up from 85.7% in 2025. In the legislative setting, parity stands at 48.2%, showing a slight increase in women’s parliamentary representation since the last edition, and a slight +1.6 percentage point increase in parity since Germany was first indexed. In Europe, there are 32 economies who have had a woman head of state in the past 50 years. Germany has the fifth-highest score among them, at 49.5%. Germany’s first score in this indicator, in 2006, was 2%. This means that almost the entirety of gains in political representation for women head of state was achieved in the past 20 years.
Ireland
Closing the top 10 is Ireland, with a gender parity score of 81.4%. This European economy has been among the top performers in 19 editions, and in 2026 ranks 7th within its regional group. Compared with the last edition, Ireland improved its overall parity score by +1.3 percentage points, from 80.1% to 81.4%. Aggregated across editions, Ireland has narrowed its overall gender gap by 8.1 percentage points, up from 73.3% in 2006. Its long-term trajectory has been one of sustained progress, driven by steady gains in economic participation and political representation while maintaining full educational parity.
In Economic Participation and Opportunity, Ireland scores 76.1%, ranking 29th globally and 11th within Europe. Compared with the last edition, the economy improved by +0.6 percentage points, while since 2006 it has narrowed its economic gap by 12 percentage points, from 64.0% to 76.1%. Across the report’s 20 editions, Ireland has retained full parity among professional and technical workers and improved gender parity among legislators, senior officials and managers, from 40.8% to 64.1%. Over time, it has recorded parity increases in labour-force participation rate, reaching 86.1% in 2026, up from 83.4% last year and 73.5% in 2006. Parity in estimated earned income also increased from 41.3% in 2006, to 64.1% in 2025, to 65.0% in 2026.
Ireland is one of the few economies to showcase full parity in Educational Attainment, recording a score of 100% and ranking among the best performers globally. The economy has maintained parity across adult literacy, primary education enrolment, secondary education enrolment, and tertiary education enrolment throughout the history of the index, making education its strongest and most stable dimension.
In Health and Survival, Ireland retains a score of 96.3%, ranking 111th globally and 33rd within Europe. Over time, the economy has seen gender parity devolve slightly from 97% to 96.3%. Sex ratio at birth increased from 93.5% to full parity at 94.4% in healthy life expectancy has gradually dropped by -4.5 percentage points across editions.
Ireland records a Political Empowerment score of 53.3%, placing it 10th globally and 6th in Europe. Compared with the last edition, the economy improved by +4.6 percentage points. Over time, however, Ireland has bridged the gap by 21 percentage points, up from 32.3% in 2006. Much of Ireland’s progress has been driven by improvements in women’s representation as head of state, where Mary McAleese’s term raised the parity score from 47.1% in 2006 to 71.2% in 2012. With Catherine Conolly’s election, Ireland’s score rises once more to 74.7%. Parliamentary representation has also more than doubled since 2006, rising from 15.3% to 33.3%, while ministerial parity increased from 27.2% to 40%.
Most populous economies
Bangladesh
Bangladesh ranks 79th in the Global Gender Gap Index 2026, with 71.2% of its gender gap closed. Compared to last year, Bangladesh records one of the largest declines in score (- 6.2 percentage points). Even so, Bangladesh has followed a positive trajectory since 2006, that places it + 8.5 percentage points ahead of its starting position.
Of all subindexes, Economic Participation and Opportunity is where Bangladesh has its lowest ranking. In 2026, it closed 41.9% of the gender gap and reports mixed results across indicators. Since the previous edition, parity in estimated earned income, labour-force participation and senior workforce leadership has been reduced by 15, 5.7 and 1.3 percentage points respectively. Compared to 2006, however, the losses are far more substantive in parity in labour-force participation (-13.1 percentage points), which dropped from a parity score of 61.1% to 48% in 2026, and in estimated earned income parity (-16.9 percentage points), from 54.4% to 37.5%. Gender parity stands at 26.2% among professional and technical workers, from an initial 33.3% in 2006.
By contrast, Bangladesh has a positive, 20-year trajectory in Educational Attainment, after reaching its highest score to date in 2026 of 96.1%. This raises its total advance towards gender parity to +9.3 percentage points, propelled by high parity gains in adult literacy rate (+31.7 percentage points) and in tertiary education enrolment (+27.3 percentage points). Higher education nevertheless remains the country’s widest education gap, with parity standing at 77.1% in 2026. For primary and secondary enrolment, Bangladesh retains parity in 2026.
Health and Survival remains virtually unchanged, with 96.0% of the gap closed in 2026. Stability in the sex ratio at birth, however contrasts, with a slight decline in parity in healthy life expectancy since 2014.
Where Bangladesh has a comparatively stronger performance is in Political Empowerment. In 2026, it ranks 12th globally with 50.9% of the gap closed. The country has retained a full parity score in the head-of-state indicator since 2019. It has also improved gender parity among ministers, raising parity from 9.1% to 23.5% over the past 20 years. At the parliamentary level, Bangladesh records its lowest level of parity over time in 2026, at 2.4%.
Brazil
Brazil retains its rank of 72 in the 2026 index, but sees its score decline from last year to 71.5%. This year’s decline (-0.4 percentage points) has a relatively small impact on the economy’s predominantly flat trajectory, in which the gender gap has narrowed by 6.1 percentage points since 2006.
Brazil has closed 66.6% of its Economic Participation and Opportunity gap, placing just outside the global top 100 on this subindex. The score is broadly unchanged from last year but stands 6.2 percentage points above its 2006 level. Long-term progress has been driven by improvements in parity scores across indicators; notably, estimated earned income (62.2% in 2026) and legislators, senior officials and managers, which rose from 58.7% to 66% in 20 years. Labour-force participation parity has also edged upwards overall, with some variation, from 70.9% to 73.1%.
Ranking among the best-performing economies, Brazil has maintained full parity in Educational Attainment across all indicators for a second year in a row. With mostly stable results over time, the South American economy has seen parity rise in primary education enrolment from 94% in 2006 to 100% in 2026.
Little variation has occurred in Health and Survival, where Brazil has closed 97.7% of the gender gap. In line with other economies in the index, parity in healthy life expectancy has decreased ever so slightly.
Where Brazil has made the most progress over time is in Political Empowerment. Despite a decline of -2.1 percentage points from the last edition, Brazil has closed over one-fifth of the gap (21.8%), boosting its parity score by +15.8 percentage points since 2006. Progress is spread across indicators, with parity in parliament more than doubling since 2006 (from 9.4% to 20.7%), and parity among ministers tripling from 12.9% to 40.9%. Brazil also accrued years of female head-of-state leadership in the last half-century that keep its indicator score at 12% since 2016.
China
In this year’s edition, China climbs seven ranks into the top 100, placing 96th with 69.9% of its gender gap closed. Compared with last year, China raised its overall score by +1.3 percentage points, and since 2006, it has narrowed its gender gap by 4.2 percentage points.
With its best performance in Economic Participation and Opportunity, China sees parity at 72.3%, which positions the economy 57th globally. The score is broadly unchanged from last year but stands 10.3 percentage points above its 2006 level. As occupational data indicators is unavailable, China’s overall score is derived from a smaller set of indicators, giving greater weight to the remaining measures.
The Eastern Asian economy’s performance in Educational Attainment increases in 2026, lifting the score by +5.3 percentage points from the last edition to 98.8%. This improvement reflects updated secondary education enrolment data. From a longitudinal perspective, China’s performance is bolstered by achieving full parity in tertiary enrolment in 2009, as well as a progressive, two-decade improvement in adult literacy, rising from 91% in 2006 to 96.6% in 2026.
In Health and Survival, despite improving its performance slightly over time, China records a score of 94.8%. The economy’s gender gap in sex ratio at birth remains, yet improvements were registered in healthy life expectancy.
Political Empowerment has changed little over the past two decades. In this edition, China achieves a 13.5% score and a 111th rank. All three indicator scores remain unchanged from the last edition. Across time, however, China has seen political representation improve the most in parliament with parity score increasing from 25.5% in 2006 to 36.1% in 2026. Parity in ministerial representation has also advanced over time, from 6.7% in 2006 to 9.1% in 2026.
Democratic Republic of the Congo
In this edition, the Democratic Republic of the Congo (59.5%, 142nd) gains one rank relative to last year, despite a slight decline in score from the last edition (-0.6 percentage points). Since joining the Index in 2018, the economy has seen gains offset by setbacks across index dimensions.
Democratic Republic of the Congo has closed 65.6% of its gender gap in Economic Participation and Opportunity. A slight improvement in score from last year (+0.4 percentage points) emerges from an improvement in perceived wage equality, yet most indicators remain unchanged since the previous edition. Gender parity in labour-force participation is comparatively high at 90.3%, although both male and female shares are lower in 2026 than in 2018. Representation among legislators, senior officials and managers also stands above 70% parity. Women remain underrepresented in professional and technical occupations, where parity stands at 43.3%.
In line with the broader Sub-Saharan African region, Democratic Republic of the Congo has the widest gender gap in Educational Attainment. With 62.3% of the gap closed, the economy sits at the bottom of the overall educational parity subindex. Tertiary education enrolment has the highest levels of disparity, with parity score stands at 59.2%. Parity in adult literacy rate follows at 63%, and parity in secondary education enrolment rate at 63.3%. Over the eight editions that the economy has been indexed, the educational gender gap has widened by 5.1 percentage points.
In Health and Survival Democratic Republic of the Congo has a comparatively better performance, ranking 50th globally, with a parity score of 97.3%. For this economy, health outcomes have remained stable over time.
Political Empowerment has improved steadily (+6.5 percentage points overall) since the Democratic Republic of the Congo first entered the index, with 12.8% of the gap now closed. In 2026, women hold one quarter of ministerial positions, equivalent to 33.3% parity, while parliamentary representation stands at 14.7% parity. Without a female head of state in the past 50 years, the economy’s score remains at zero.
Egypt
Egypt places 138th in this year’s index, having closed 63.2% of its gender gap. The Northern African economy moves up one place in this year’s rankings and improves its overall score by 0.7 percentage points compared with last year. Since 2006, Egypt has narrowed its gender gap by 5.3 percentage points, with most of that progress taking place in the education and political subindexes.
In Economic Participation and Opportunity, Egypt has the most ground to cover, as gender parity reaches 44.8%. This year’s 4.2 percentage-point increase marks a recovery after a multi-year negative trajectory. This edition’s boost came from a +7.4 percentage-point jump in parity in labour-force participation rate (33.6%) and a +9.5 percentage-point increase in estimated earned income (27.9%). Even so, the subindex has exhibited considerable volatility over time, leaving Egypt’s long-term improvement at just 3.2 percentage points since 2006 and among the lowest scores globally.
Educational Attainment is one of Egypt’s strongest-performing dimensions, at 96.9%. The score has improved by 6.6 percentage points since 2006, driven by broad-based gains across most indicators. The economy has maintained parity in primary and tertiary enrolment for several consecutive editions, while parity in secondary enrolment has curved upwards again reaching 97.9% in 2026, after dropping from full parity in 2022. Parity in adult literacy has recorded the largest advance over time, increasing from 68.7% parity in 2006 to 85.9% in 2026, although it continues to account for the largest education gap.
Virtually no changes are recorded in Health and Survival compared to the last edition, where parity reaches 96.9%. However, parity in healthy life expectancy has been in modest decline over time.
Political Empowerment has the largest long-term improvement of any subindex. Egypt advanced from 2.2% to 14.2% in 20 editions, lifting parliamentary representation sharply over two decades, from 2.0% parity in 2006 to 36.7% in 2026. In the cabinet, parity has also improved over time, from 6.3% to 11.5%. In contrast, the head-of-state indicator remains at zero.
India
In India, progress towards gender parity stands at 64.5%. With a slightly improved individual score, India retains the 131st position in the global ranking. Its overall gains towards gender parity amount to a +4.3 percentage-point advance since 2006, localized primarily in Educational Attainment.
In Economic Participation and Opportunity, India reports a 41.2% parity score – higher than the previous edition by +0.5 percentage points, but lower by 3.5 percentage points from its best result in 2013 (44.6%). Over time, India’s scores on economic parity have varied significantly, muting its overall 20-year progress to +1.5 percentage points. Strong advances in professional and technical workers doubled parity from 26.6% in 2006 to 49.9% in 2026. Representation among legislators, senior officials and managers also improved by +10 percentage points since the 2006 edition but remains comparatively low, at 13.1%. Parity in labour-force participation has increased little over the past two decades, standing at 44.1% in 2026.
In Educational Attainment India posts a 96.6% parity score. The result carries a slight reversal from last year’s performance (-0.5 percentage points), with an even lesser impact on the economy’s overall progress over time (+14.7 percentage-point gain). In 2026, India maintains full parity in both secondary and tertiary enrolment and retains a near-parity score in primary education enrolment. Parity in adult literacy (82.5%) is the sole indicator to decrease slightly (-2.7 percentage points) year on year, yet here too India shows a strong upwards trend lifting parity from 65.2% in 2006 by +17.4 percentage points.
In Health and Survival India improves its score from last year’s edition, reaching 95.6% parity. Despite it following an upwards trajectory since 2017, in 2026, sex ratio at birth continues to stand nearly one percentage point lower than in 2006.
Political Empowerment is India’s highest ranked subindex in 2026, with 24.5% of the gap closed and a global rank of 67th. Despite this, the Southern Asian economy has seen its score decline since a drop in 2019, and its overall gains in closing the political gap reduced to a 1.8 percentage point shift since 2006.
India had one of the highest starting parity scores on the head-of-state indicator (42.9% in 2006), which increased to 72.3% over the index’ first decade, reflecting many years of female leadership within the indicator’s rolling 50-year reference period. However, since 2021, the indicator’s score declined to its present 40.7%. Across other indicators, parity remains comparatively lower. In parliament, the gender gap is 16.1% closed in 2026. This represents an overall gain of 7 percentage points since 2006. At the ministerial level, India has made an overall advance of 2.4 percentage points, from 3.5% in 2006 to 5.9% in 2026. This marks a strong decline from the economy’s highest score of 30%, from 2019.
Indonesia
Indonesia ranks 106th in the Global Gender Gap Index 2026, with 68.7% of its gender gap closed. Within Eastern Asia and the Pacific, Indonesia places 13th. Compared with last year, the economy drops nine positions, and its parity score declines by 0.4 percentage points. The decrease reflects small setbacks across every subindex except Health and Survival. After more than a decade of gradual improvement, progress has slowed since 2023, bringing Indonesia’s overall gain since 2006 to 3.3 percentage points.
Indonesia has closed 66.6% of its gender gap in Economic Participation and Opportunity in 2026.The score slips by 0.2 percentage points from last year but remains 6.8 percentage points above its 2006 level. Much of this long-term progress has come from women’s representation in the workforce. Indonesia reached full parity among professional and technical workers in 2016 and has maintained it since 2022. Parity among legislators, senior officials and managers has also more than doubled over two decades, rising from 20.5% in 2006 to 49.4% in 2026.
Educational Attainment stands at 96.9%, placing Indonesia 111th globally. The country has narrowed its education gap by two percentage points since 2006, driven largely by gains in tertiary enrolment, where parity has increased by 20.6 percentage points and the gap has now closed. Primary (96.1%) and secondary (96.7%) education enrolment remain the largest education gaps.
Health and Survival continues to be Indonesia’s most stable subindex. Both the score and ranking have shown little variation over time.
Political Empowerment in Indonesia has made more limited progress. After improving between 2014 and 2018, the subindex has moved backwards, with parity falling to 14.6% in 2026. Indonesia ranks outside the global top 100 on this measure. Since 2006, Political Empowerment has improved by 4.5 percentage points, but parity remains below 30% across every indicator, leaving women underrepresented in parliament, ministerial positions, and head-of-state leadership.
Iran (Islamic Republic of)
Iran ranks 144th in the Global Gender Gap Index 2026, with 58.5% of its gender gap closed. Over the past two decades, Iran has not reached higher rankings and retained a flat trajectory.
With 35.1% of the gap closed, Iran has the lowest performance in Economic Participation and Opportunity, ranking 145th globally. Although the score slightly improves from last year, it remains nearly one percentage point below its 2006 level (35.9%). Labour-force participation parity has progressively declined, being effectively halved in 2026 (20.9%) compared to 2006 (52%). This drag on economic parity is somewhat offset by modest gains in workforce representation. Parity in legislators, senior officials and managers has a higher score than last edition by +1.8 percentage points, reaching 25.5%, and over time, from 14.9% in 2006. Professional and technical occupations have also moved closer to parity by +7.4 percentage points since 2006, to 56.7%. The gender gap in estimated earned income has widened over time, with parity score from 28.5% to 16.3% in 2026.
In Educational Attainment, Iran shows higher levels of parity. In 2026, it has closed 98.4% of the gap, advancing by +3.1 percentage points since 2006. Full parity is reached or maintained in primary, secondary and tertiary enrolment, and adult literacy has recovered to 91.7%, almost matching its 2023 score of 92%.
Health and Survival has not shifted significantly overall, with a score of 96.1%. However, parity in healthy life expectancy has declined since 2006 by -5.5 percentage points.
At present, 4.6% of the political empowerment gap is closed. Although the score has increased modestly since 2006, Iran ranks 139th globally on this subindex. Women’s representation in ministerial and parliamentary spheres has seen some level of increase over time (+4.8 and +0.9 respectively), yet insufficient to raise parity scores above 12% and 5.2% in 2026. The head-of-state indicator remains at zero, as Iran has not recorded any years of female leadership within the past half century.
Japan
Improving its score (+0.4 percentage points) and ranking (+1) from last year, Japan comes in 117th in 2026 with a gender parity score of 67.0%. The economy still lags behind its regional block, as the third-lowest position in Eastern Asia and the Pacific. It records a +2.6 gain in gender parity since 2006, driven predominantly by increases in economic and political parity.
In Economic Participation and Opportunity, Japan records a score of 60.9% in 2026, down from 61.3% in 2025. The economy has had a variable trajectory, narrowing its gender gap in the past 20 years by +6.4 percentage points. This reduction stems in part from improvements in workforce representation, with absolute increases in parity registered in labour-force participation rate (+13.1 percentage points); professional and technical workers (+8.6 percentage points); and legislators, senior officials and managers (+5.7 percentage points). Parity in estimated earned income in Japan has also increased by a total of +14.1 percentage points across the 20 editions of the index.
In Educational Attainment, Japan achieves a score of 99.4%, which places it 68th globally and 8th within Eastern Asia and the Pacific. Since it was first indexed, the economy has maintained full parity in adult literacy and primary education enrolment. Its sole remaining gap is concentrated in tertiary education enrolment, where parity reaches 97.4% in 2026.
In Health and Survival, Japan has a broadly stable trajectory over time, experiencing a decrease in parity in healthy life expectancy, alongside a broader set of economies.
Despite having a low departure point in Political Empowerment, developments within the past decade have translated into increased political parity in Japan. In 2026, the Political Empowerment gap stands 10.5% closed. Over time, Japan has experienced modest improvements in political representation at ministerial and parliamentary levels, which have shifted parity by +4.5 percentage points and +6.8 percentage points, respectively. However, Japan recently elected its first female prime minister, Sanae Takaichi, a historical development that raised its 2026 indicator score to 1.3% and contributed to a positive shift in the subindex trajectory.
Mexico
Mexico ranks 18th in the Global Gender Gap Index 2026, with 78.7% of its gender gap closed. It is the third-highest ranked economy in Latin America and the Caribbean. Compared with last year, its score improves by 1.1 percentage points. Since 2006, Mexico has reduced its gender gap by 14.1 percentage points, climbing from 64.6% to break into the global top 20 for the first time. At its current pace, the country is projected to close its remaining gender gap within 31 years, placing it among the 10 economies expected to reach parity the first.
Mexico has closed 61.8% of its Economic Participation and Opportunity gap. Although this remains its weakest-performing subindex and the widest economic gap in the region, the trend has been positive. The score is up 0.9 percentage points from last year and 13.8 percentage points since 2006. The biggest gains have come from women’s representation in the workforce. Parity among legislators, senior officials and managers has nearly doubled, rising from 33.3% to 64.8%, while professional and technical workers are now close to full parity at 98.9%, up 32.2 percentage points over the two decades of the index. Parity in estimated earned income (54.9%) and perceived wage equality for similar work (51.3%) remain the country’s largest economic gaps.
Educational Attainment is nearly at parity, with a score of 99.5%. Mexico has maintained full parity secondary and tertiary enrolment since 2016. Since 2006, adult literacy parity has improved by 1.5 percentage points and tertiary enrolment by 1.8 percentage points, lifting the overall score by 0.3 percentage points.
Health and Survival remains one of Mexico’s strongest areas. With a score of 98.0%, the country shares first place globally. Both the score and ranking have remained broadly unchanged over time.
Mexico has made its greatest gains in Political Empowerment. The country has now closed 55.7% of the political gender gap, improving by 3.5 percentage points since last year and by 42.4 percentage points since 2006. It ranks eighth globally and first in the region. Mexico has reached full parity in parliamentary representation, while achieving 90.9% parity in ministerial positions. Head-of-state parity remains comparatively low at 5.1%, but Mexico is now accumulating years of female leadership under President Claudia Sheinbaum, gradually raising its score on this indicator.
Nigeria
Nigeria has closed over two-thirds of its gender gap in 2026, with a gender parity score of 67.6%. Compared to 2025, Nigeria improved its score by +2.7 percentage points, from 64.9%, and its overall ranking by +10 places. Over the past two decades, the Sub-Saharan economy has advanced a total of 6.6 percentage points from its 2006 score of 61%. After several years of limited movement, the economy records in the current edition one of its strongest annual improvements.
Among the 30 best performers in Economic Participation and Opportunity, Nigeria has raised its economic parity score to 76.6% – the 7th highest in its region. The score has increased by +0.4 percentage points since the previous edition of the index and represents a 20-year improvement of +15.4 percentage points, up from 61.2% in 2006. Over time, the economy’s performance has been boosted by gains in workforce parity: parity in labour-force participation rate improved from 53.5% in 2006 to 97.4% in 2026. Nigeria has also reported strong advances in estimated earned income parity, lifting its score from 41.1% in 2006 to 77.1% in this edition.
Educational Attainment remains Nigeria’s second-lowest ranked subindex, reflecting persistent gender gaps in educational access accumulated over time. This is evident in the adult literacy gender gap, which has closed by 79.6%. In 2026, Nigeria has reached full parity in secondary education enrolment, which increased by +17.5 percentage points since 2006.
In Health and Survival, Nigeria records a score of 96.2%, with health outcomes remaining broadly stable throughout time.
In Political Empowerment, Nigeria has the most terrain to cover, with 96.3% of the gap left to be closed. In this subindex, Nigeria is third from the bottom on the overall index. Parity at ministerial and parliamentary levels does not only sit below the 10% threshold but has declined more than 1 percentage point over time on both indicators. The economy continues to record 0% parity at the head-of-state level.
Pakistan
Coming in 143rd is Pakistan, with a relative improvement in its 2025 standing of five ranks. The Southern Asian economy also showed absolute improvement in its 2026 score of 59.5%, higher than last year’s edition by +2.8 percentage points. While Pakistan remains among the lowest-ranked economies in the index, it has nonetheless narrowed its gender gap over time by 5.2 percentage points, up from 54.3% in 2006. Furthermore, the 2026 edition marks its strongest year-on-year improvement in a decade, driven primarily by substantial gains in Educational Attainment.
Despite modest gains in recent editions, Economic Participation and Opportunity remains Pakistan’s weakest-performing subindex and the principal constraint on overall gender parity. Pakistan records a score of 36.4%, ranking 144th globally and last within Southern Asia. Compared with the previous edition, economic gender parity improved by +1.6 percentage points, although its score remains 0.5 percentage points below its 2006 level. Pakistan has the eighth-widest workforce gender gap overall, with parity in labour-force participation at 34.6%. Women account for 44.9% of professional and technical workers and 6.5% of legislators, senior officials and managers, despite the latter figure having tripled over time. Estimated earned income parity stands at 26.3% yet has declined over two decades by -7.7 percentage points.
Better results emerge in Educational Attainment, where Pakistan reaches a record high parity score of 91.7%, over 6 percentage points higher than the previous edition and amounting to its largest annual gain across the four subindexes. This aligns with broader gains that results in a 21 percentage-point advance towards parity since 2006, from 70.6% to 91.7%. Across primary, secondary and tertiary education enrolment indicators, Pakistan has increased parity by +20 percentage points over time, making Educational Attainment the principal driver of overall performance.
In Health and Survival, Pakistan records a score of 95.9%. The subindex has shifted upwards by 0.8 percentage points compared to 2006, due to improved parity in healthy life expectancy.
Pakistan records a Political Empowerment score of 14.1%, ranking 107th globally and 4th within Southern Asia. Since the last edition, parity at parliamentary and ministerial levels increased by +7.1 and +3.6 percentage points respectively, yet both indicators failed to reach Pakistan’s highest scores to date. In addition, its head-of-state score remains at 0.104 since 2010.
Philippines
Remaining in 20th place for a consecutive year, the Philippines records a slightly lowered gender parity score in 2026, of 78%. The economy remains one of the most consistent and higher ranked performers in Eastern Asia and the Pacific, coming in 3rd this edition. Despite this, the Philippines has failed to keep the momentum that kept the economy in the top 10 on 13 prior editions. Over two decades, the archipelago has narrowed its overall gender gap by 2.8 percentage points, which started at 75.2% in 2006.
The Philippines has closed over three-quarters of its Economic Opportunity and Participation gap, recording a top 20 overall score of 78.3% in this subindex. Nevertheless, the result entails a -0.8 percentage-point decline for the economy, reducing its two-decade advancement to a total of + 2.5 percentage points over its 2006 score. Over time, economic indicators have had varying trajectories. Estimated earned income parity increased most of all, by +14.6 percentage points from 59.4% in 2006 to 74% in 2026. Workforce representation for professional and technical workers has remained static, at full parity. Yet, while professional and technical workers participate equally, those in the legislator, senior official, and manager category record more fragility since 2024. Since the previous edition, parity of legislators, senior officials and managers dropped by -10.5 percentage points.
In Educational Attainment, the Philippines is among the top 100 economies (89th) with a score of 98.9%. While that is higher than last year’s score (98.8%), it remains 1.1 percentage points below its 2006 score. With the economy maintaining full parity across most indicators, the sustained decline of parity in primary education enrolment (from 100% in 2024 to 97.5% in both 2025 and 2026) impacts the economy’s trajectory negatively.
In Health and Survival, the Philippines has a parity score of 96.9%. Health outcomes have remained broadly stable over time, with a modest negative variation in score recorded in sex ratio at birth.
Where Political Empowerment is concerned, the Philippines sees parity remain stable compared to last year, at 37.9%. Over the past two decades, the economy has increased political parity by 10.9 percentage points – partly due to sustained gains in parliamentary representation parity, which in 2026 rises 39.5% from 18.6% in 2006. By contrast, ministerial representation remains comparatively lower at 21.1%.
United States of America
Included among the top 50, the United States places 47th in 2026, with a parity score of 74.9%. Compared with last year, the economy slips five places and loses -0.8 percentage points. Looking over the past two decades, however, the United States of America has narrowed its overall gender gap by 4.5 percentage points. Within Northern America, it falls behind regional leader Canada.
The United States of America sees its second-best performance in Economic Participation and Opportunity, where it has closed 77.3% of the gap. Their score improved by 1.1 percentage points from last year and stands +1.5 percentage points above its 2006 level. The country’s overall advances are muted by variance among indicators. Estimated earned income parity has seen the largest long-term improvement (+3.1 percentage points since 2006). Women have matched or exceeded men’s representation among professional and technical workers, resulting in full parity scores since 2006. Leadership roles tell a different story, as parity among legislators, senior officials and managers has been reduced by -10.8 percentage points over time, reaching in 74.4% in 2026. Parity in labour-force participation has shifted by slightly less than +3 percentage points over the past two decades and stands at 84.5% in 2026.
The United States of America has reached full parity in Educational Attainment for the second consecutive year, placing first globally on this subindex. Full parity is maintained across literacy, primary, secondary and tertiary enrolment, bringing the economy 1.8 percentage points above its 2006 score.
Health and Survival remains broadly unchanged at 97.3%. Only a modest decline in parity for healthy life expectancy is recorded.
Political Empowerment continues to be the economy’s weakest-performing area across subindeces, with 24.9% of the gap closed, which places the United States of America in the middle tier of economies in this subindex. The Northern American economy’s score falls by -4.1 percentage points from last year but remains 15.2 percentage points higher than in 2006. The decline compared to the last edition is driven primarily by a lower share of women ministers, with parity falling from two-thirds in 2025 to one-half in 2026. Parliamentary representation has remained broadly stable at 40.5% parity, more than doubling since 2006. The head-of-state indicator remains at zero.
Viet Nam
Viet Nam ranks 84th in the Global Gender Gap Index 2026, with 70.7% of its gender gap closed. The economy falls 10 places from last year, following a 0.6 percentage-point decline in its overall score. The recent decline only partially offsets the gains made over the past two decades of approximately +1.8 percentage points since 2007, when it was first indexed.
Economic Participation and Opportunity remains Viet Nam’s strongest-performing subindex, where the economy ranks among the top 50, with 75.2% of the gap closed. Compared to the previous edition, Viet Nam scores slightly lower (-0.7 percentage points) while remaining above its 2007 level of 74.5%. With high result variance over time, Viet Nam has advanced parity the most among legislators, senior officials and managers, from 28.5% parity in 2007 to 40.1% in 2026. Parity in professional and technical occupations has not dropped from 100% since it was first indexed. However, despite boasting a high labour-force participation rate parity score of 88.3%, Viet Nam has seen labour-force parity erode since 2007 by -5.6 percentage points.
Educational Attainment stands at 97.1%, placing Viet Nam 108th globally. The country has made gradual progress since 2007, driven by gains in adult literacy (+5.2 percentage points) and the achievement of full parity in tertiary enrolment in 2012. However, the absence of data for primary and secondary education during the index’ first decade makes progress in this area difficult to establish.
Health and Survival is largely unchanged over time at 95.2%, although Viet Nam continues to rank near the bottom globally because of widening disparities in the sex ratio at birth.
Political Empowerment remains Viet Nam’s lowest-performing subindex, with 15.3% of the gap closed. The score falls by -2.1 percentage points from last year, leaving the economy just outside the global top 100. Gender parity among parliamentarians fell to 42.9%, below the economy’s best score of 45.7%. Ministerial parity also fell, from 12.5% in 2025 to 7.7% in 2026. The head-of-state indicator remains close to zero, reflecting a small period of years of female leadership over the past 50-years.
Speed of progress
The Global Gender Gap Report is the longest-standing index for gender parity, offering a unique overview of national, regional and global evolution across the four dimensions measured by the index. In its 20th year, the report analyses long-term progress made by a group of 97 economies that have been featured in the index since 2006.
The first pattern emerging is overwhelmingly positive, as the near entirety of economies in the sample have improved their overall gender parity score since 2006. The sole exception is Sri Lanka. On average, economies have advanced by approximately +6.2 percentage points across the 20 editions of the index.
Beneath the aggregate, however, is a less than linear path to parity. While the sample’s long-term direction has been positive, year-to-year fluctuations trace periods of acceleration, plateau and even decline, as seen in Figure 1.10.
Collective evolution year on year
Whereas the global gender parity score measures the magnitude of progress, analysing the share of economies that improve in each edition offers insights into the breadth of progress, or collective evolution, across the cohort of constant economies included since 2006.
As a complementary analysis, it illustrates how progress is distributed across economies, rather than how much progress has been achieved in the aggregate. Since the index is a weighted instrument, the global gender parity score reflects changes in accordance with population size, meaning a handful of populous economies can have an oversized effect on the global score, as they encompass a broader share of the global population.
To round off our understanding of change, a metric for collective evolution of the gender gap helps track how progress is diffusing across economies and throughout the time series
Figure 1.11 shows that collective progress has unfolded in waves rather than at a constant pace. A first period of collective advance occurred between 2012 and 2015. During this wave, between 60% and 69% of the sample reported score improvements. Between 2015 and 2016, however, the trend reversed, pushing nearly two thirds (58%) of the sample into decline.
The COVID-19 period capped another forward-advancing period that had begun in 2016, which at its peak included three-quarters of the sample (76.3%) experiencing positive results between 2018 and 2020. While over a tier of the economies indexed experienced setbacks in parity in the aftermath of the pandemic, a transition towards recovery was recorded by more than half of the sample from 2024 onwards.
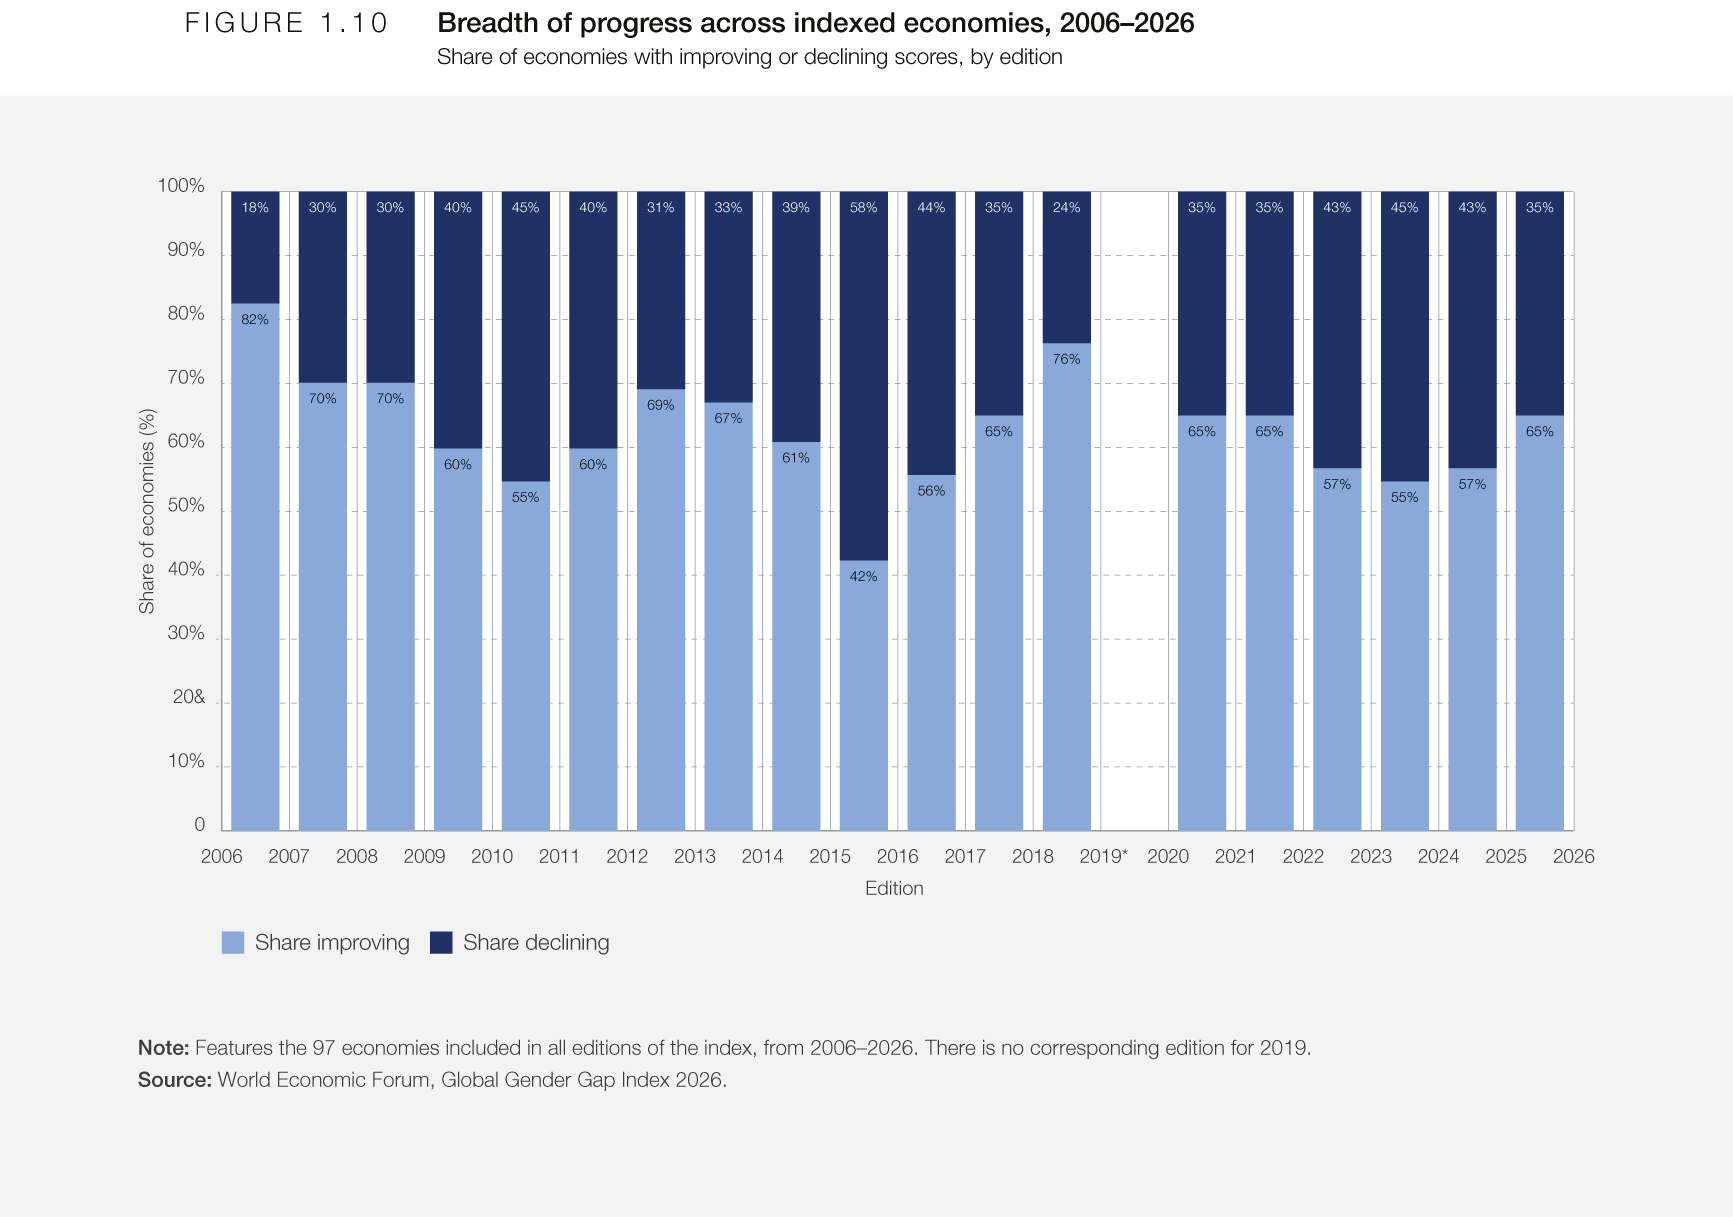

Speed of change
Across editions, the state of parity has dynamically evolved, improving or reducing global results, thus speeding up or slowing down the timeline to parity. An analysis of the starting, mid, and latest point in the index’ 20-year time series reveals that, across index dimensions, gender parity has progressed in a sustained manner in only two subindexes (Figure 1.12).
Economic Participation and Opportunity and Educational Attainment all see smaller gender gaps in 2026, compared to 2006 and 2016. Political Empowerment is the only dimension with a clear reversal, with gender parity being higher in 2016 than in 2026.
At the indicator level, dynamic variation is also present. In Political Empowerment, two indicators have lower parity levels in 2026 than in 2016: head of state and women at ministerial level. In Economic Participation and Opportunity, professional and technical workers see lower levels of parity at the end of the index time series. In Health and Survival, it is healthy life expectancy that reports a wider gender gap in 2026 than in 2006 and 2016.
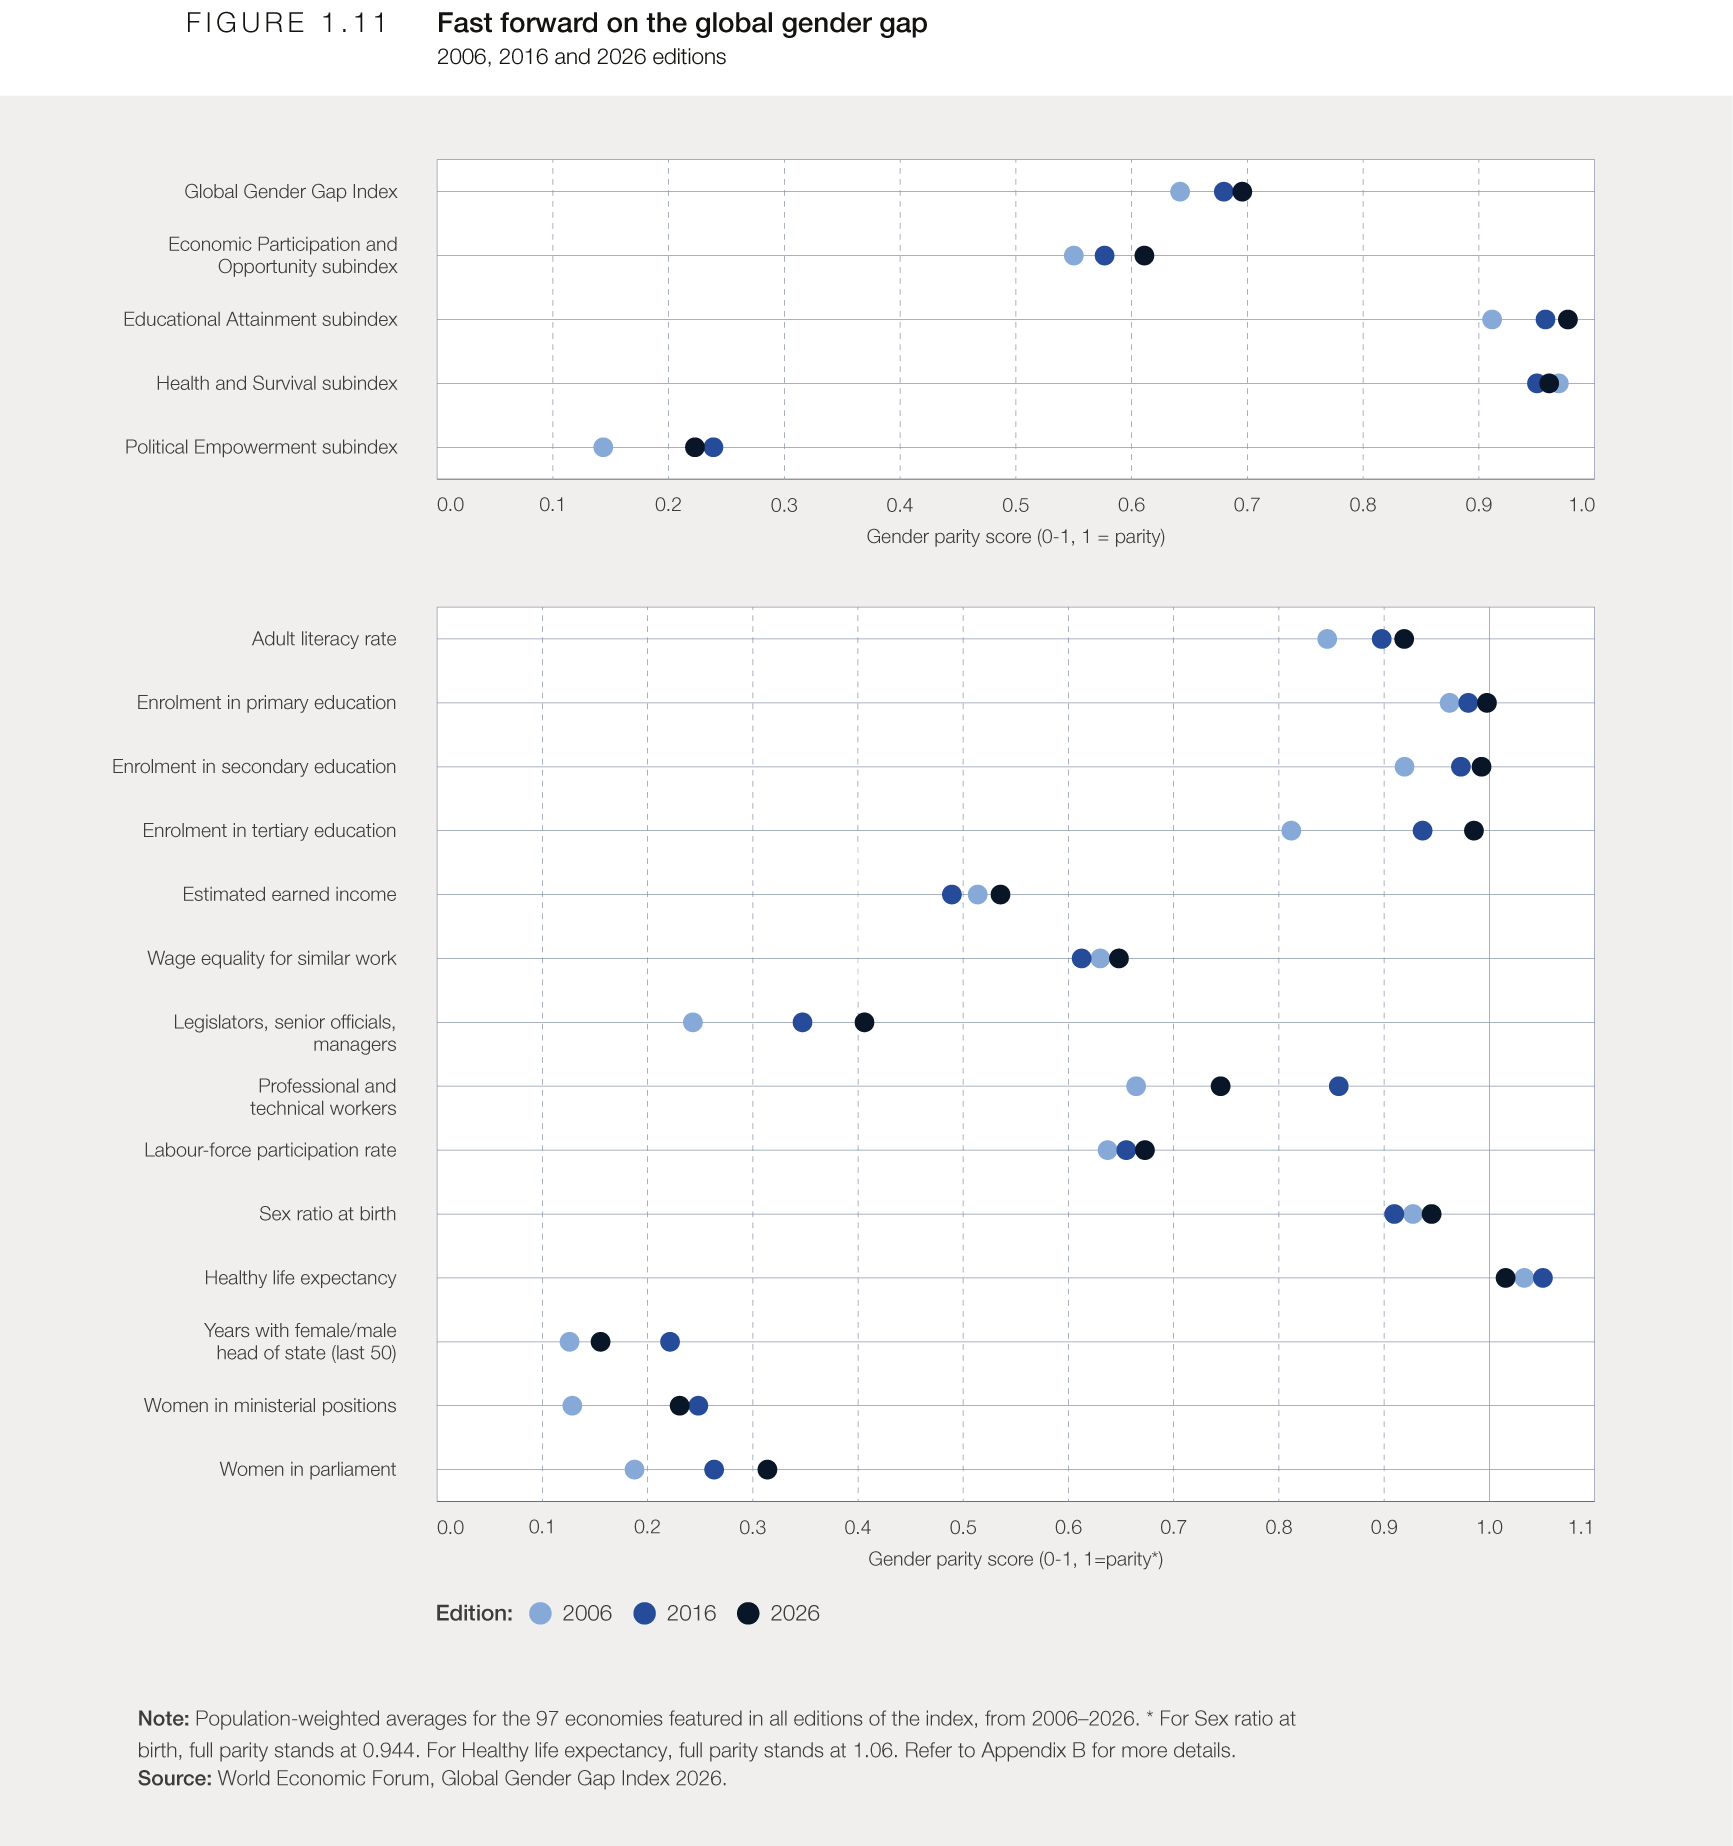

Speed by income level
When filtered by income level, as seen in Figure 1.13, economies featured in both the first and twentieth edition of the report show no association between speed and level of resources. These results show that rapid progress is not confined to any one level of economic development, with several middle-income economies outpacing their higher-income peers over the past two decades.
However, within income groups, economies display a broad range of velocities. Among high income economies, Saudi Arabia has the strongest average annual improvement since 2006, followed closely by France, Chile and Iceland. In the upper-middle income group cluster are some of the fastest economies overall, led by Ecuador, Guatemala and Mexico. Namibia and Nepal record the highest annual rates of progress among low middle income economies and rank among the fastest-moving economies in the entire sample. Although the low income group contains fewer economies in its count, it includes economies with relatively fast rates of progress, such as Burkina Faso.
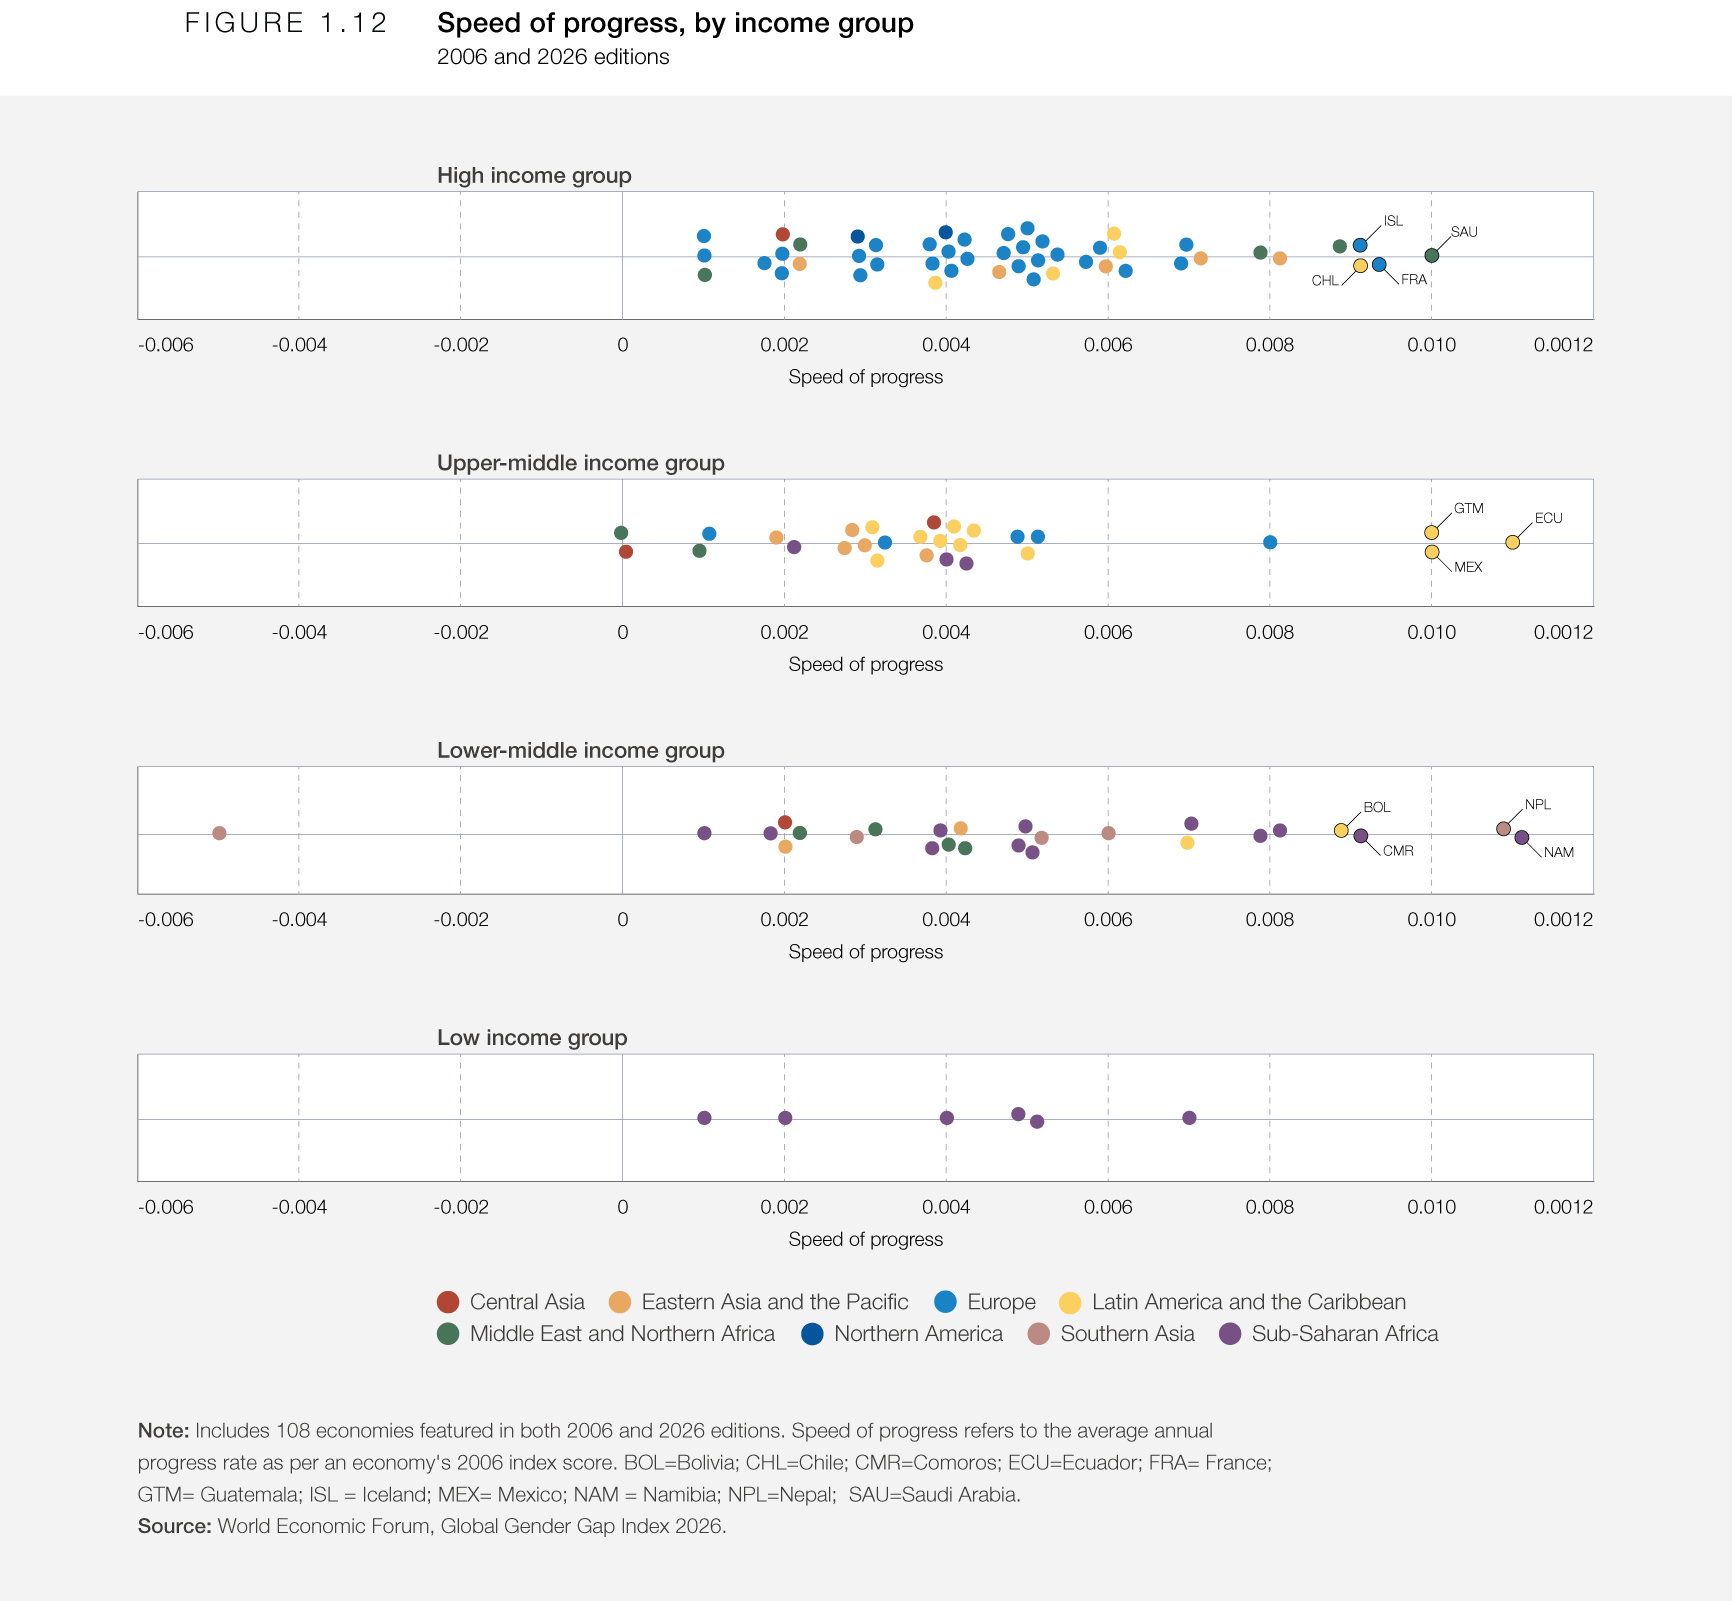

Projections based on speed of change to date
Considering the group of 108 economies featured in both the first and twentieth editions of the report, our analysis finds that absolute levels of progress differ significantly between economies.
In terms of overall gains, the economies that have made the absolute biggest leaps to gender parity are Namibia, Iceland, Ecuador, Mexico, Guatemala, France, Bolivia, Chile and Nepal. Collectively, this group has improved their overall individual parity score by more than 12 percentage points since 2006. At the other end of the spectrum, Iran (Islamic Republic of), Kuwait, Kazakhstan and Sweden have remained within one percentage point of their 2006 baseline.
Furthermore, using each economy's average annual rate of progress since 2006, the report estimates the implied number of years required to close the remaining gap if such pace were maintained. This relatively small group of economies has maintained a sufficiently consistent and rapid rate of improvement to be able to reach parity the fastest, within the coming decades (Figure 1.14). Iceland leads the group, followed by Namibia, Ecuador, the United Kingdom, Mexico, Finland, France, Australia, Chile and Guatemala. Based on current pace of progress, all these economies would be poised to close the gap within the next 40 years.