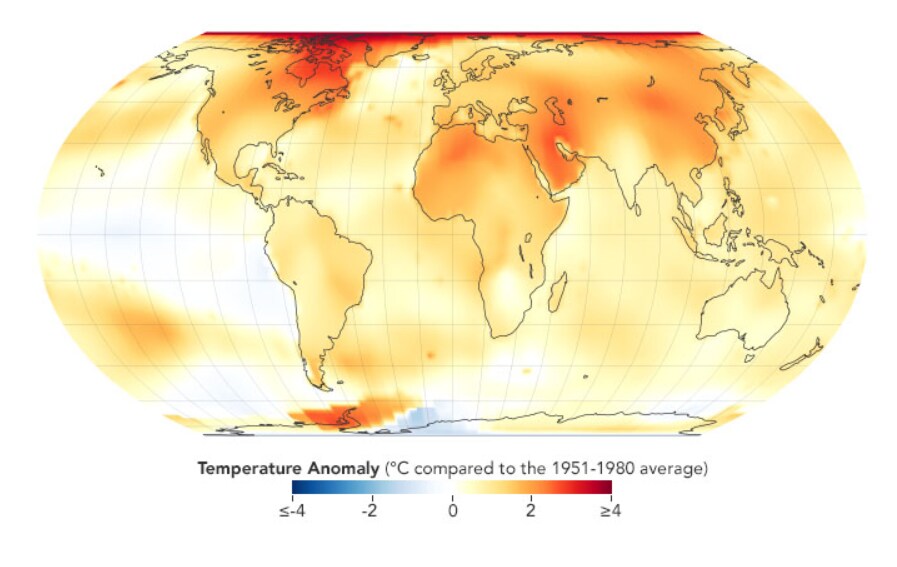
The rate of global warming has rapidly increased in recent decades.
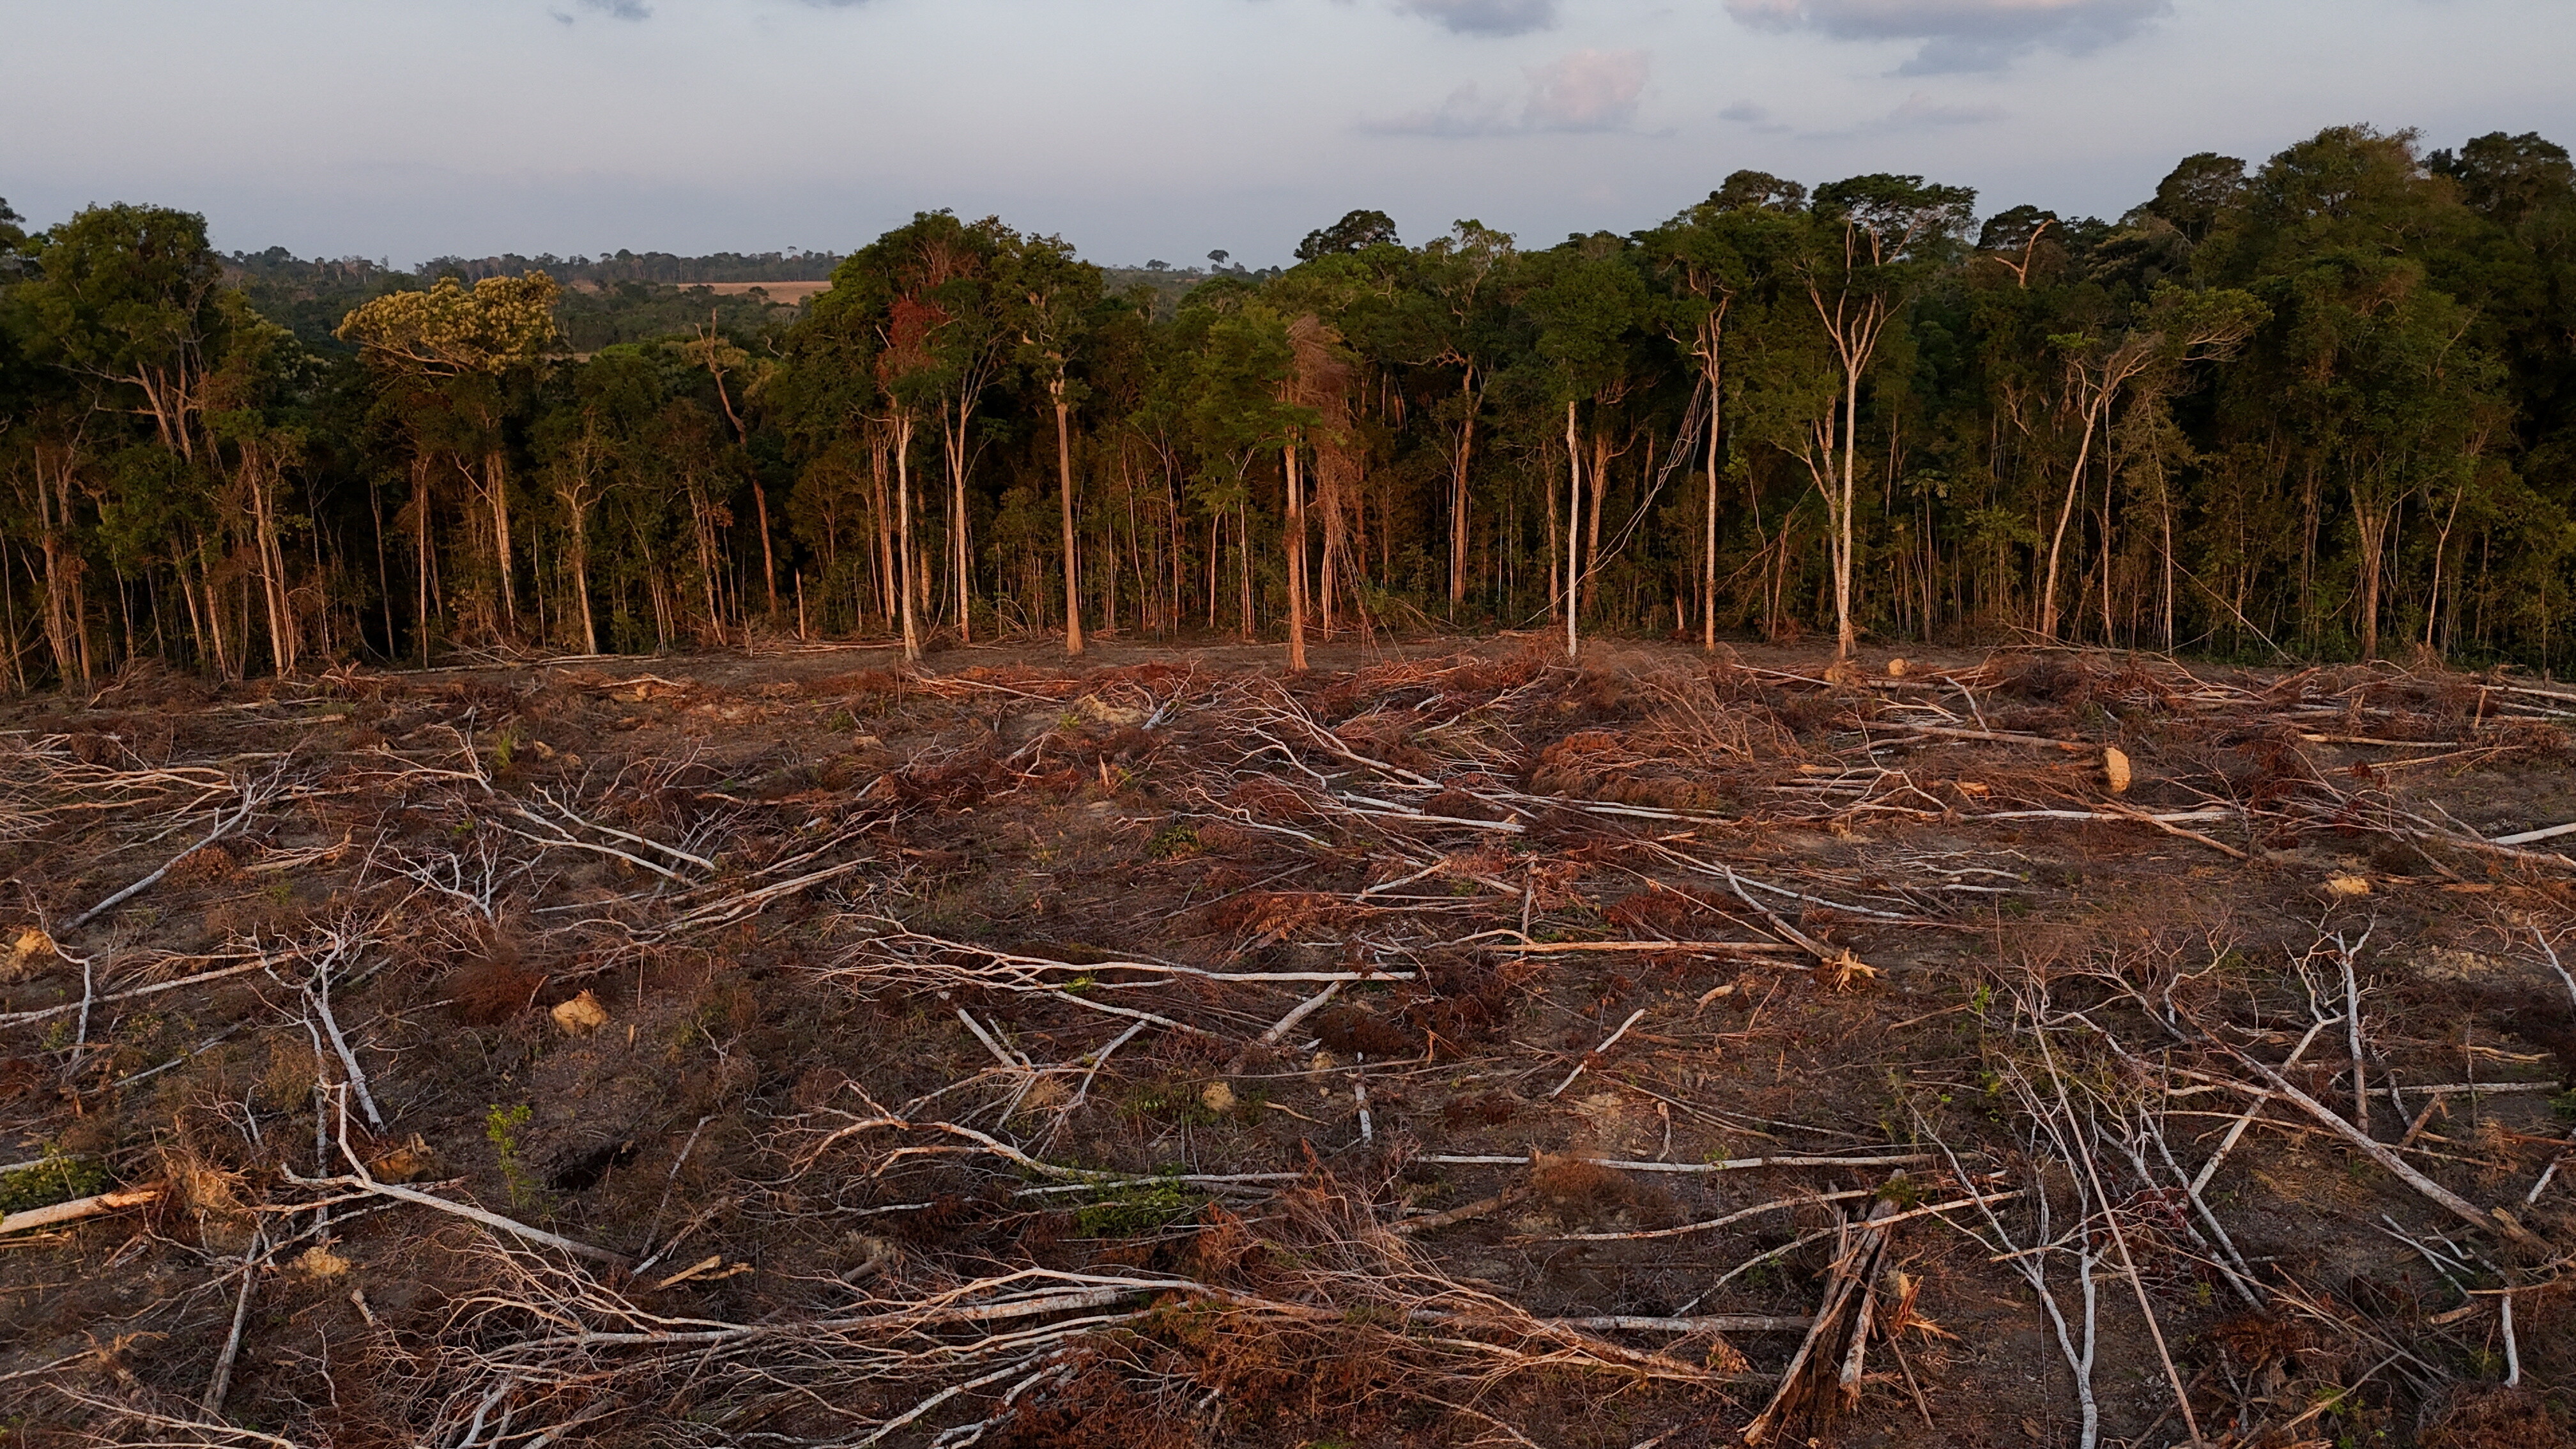
Experts agree that climate change is exacerbating dangerously high temperatures across the world.
Yearly global heat maps—published by NASA, the US space agency—can illustrate how much hotter the world is today than when you were born.
Unrelenting heat waves across the world this week laid bare the grim realities of increasingly extreme temperatures.
Across Europe, thousands were evacuated as wildfires raged in soaring heat. In the United Kingdom, where thermostats rose above 40C for the first time in recorded history, major internet servers were knocked offline due to cooling system failures and planes had to be diverted from melting runways. Meanwhile, in North America, several US states recorded record daily temperatures, with multiple major cities declaring heat emergencies and opening cooling centers for the public.
Experts agree that global temperatures are rising at an unnervingly quick rate — and that the extreme heat we are witnessing today is exacerbated by climate change.

Inflamed by the climate crisis, severe heat waves worldwide are increasingly imposing a major economic and human toll.
One study published in 2021 found that heat waves during four particularly hot years in the past two decades stunted economic growth in Europe by up to 2.5 times more than heat waves in other average years. Moreover, the World Health Organization estimates that over 166,000 people died from extreme heat between 1998 and 2017.
Understanding global warming through heat maps
To visualise the rapid rate of global warming, scroll through the heat maps below to examine temperature anomalies throughout the decades and see just how much the world's temperature has risen since the year you were born.
Years: 1930-1934
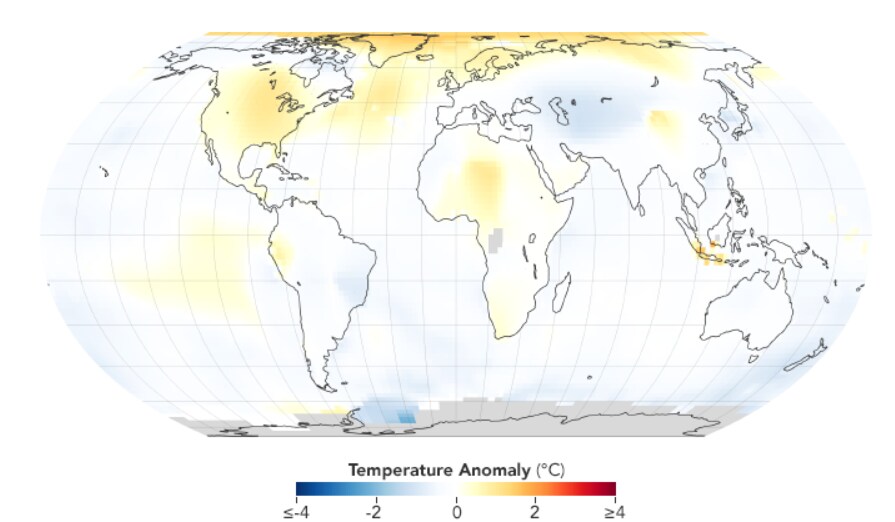
Years: 1935-1939
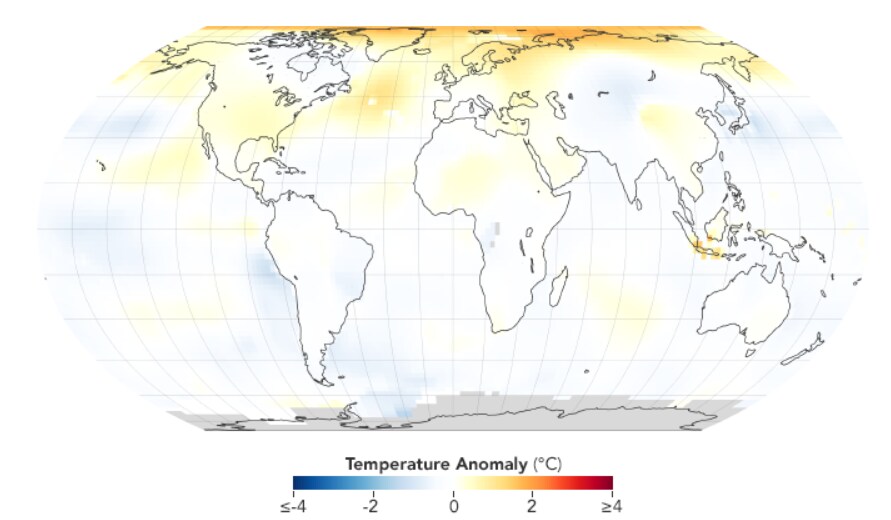
Years: 1940-1944
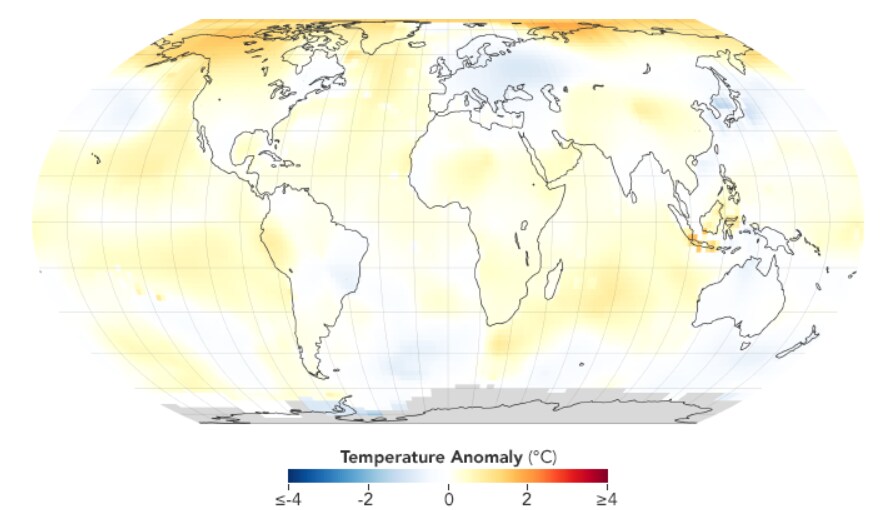
Years: 1945-1949
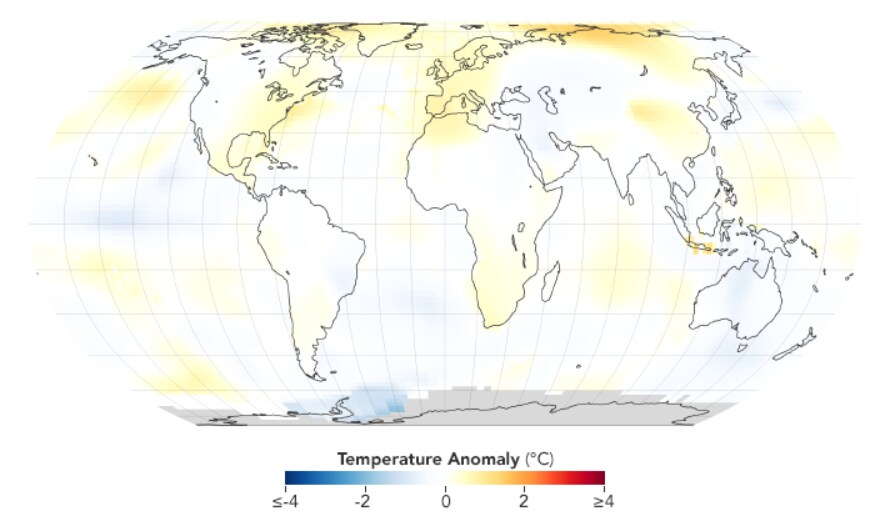
Years: 1950-1954
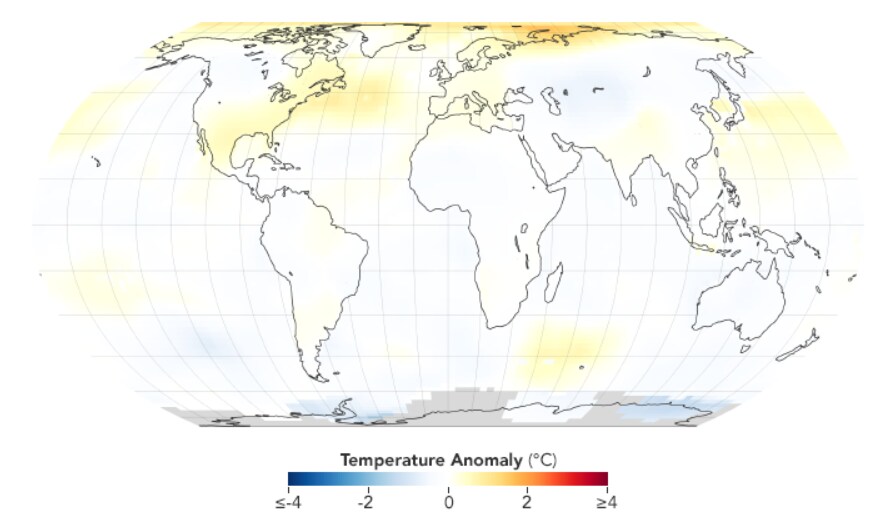
Years: 1955-1959
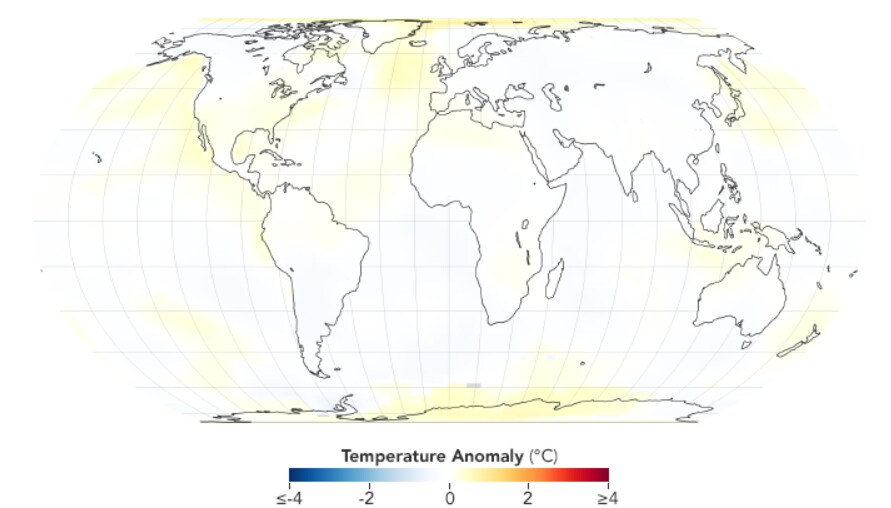
Years: 1960-1964
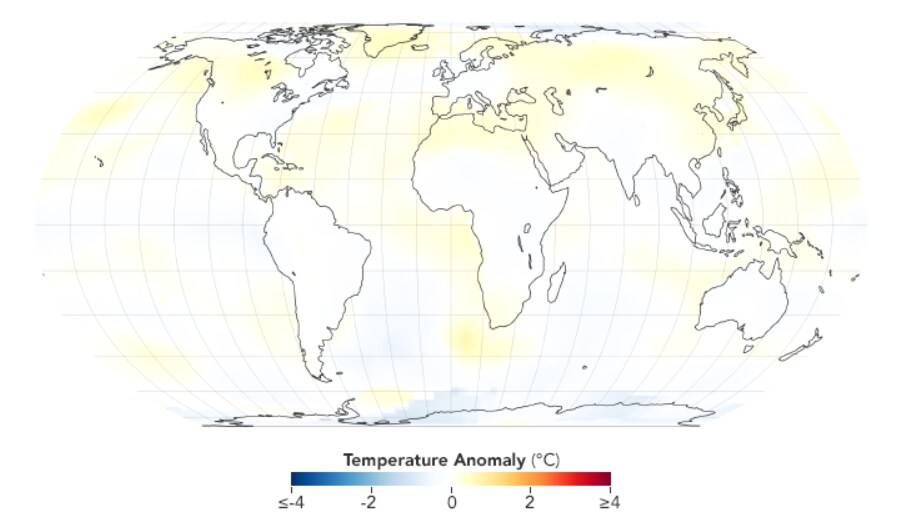
Years: 1965-1969
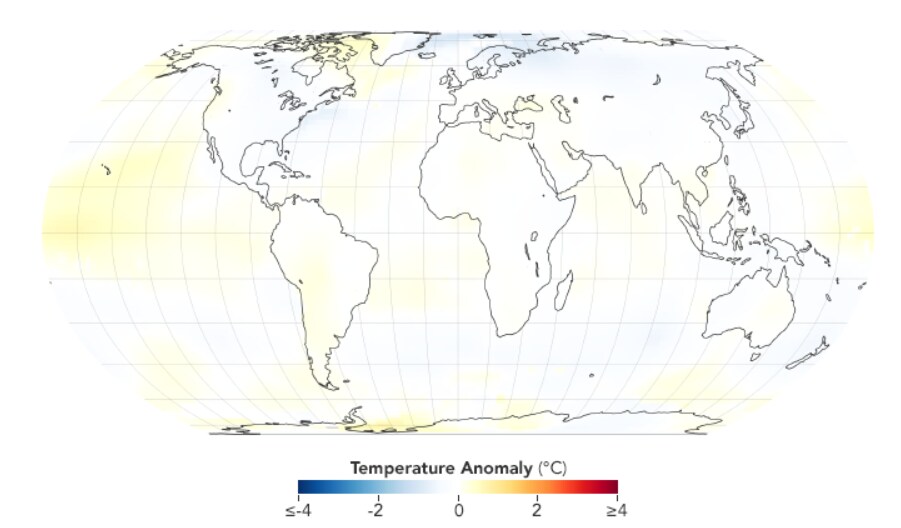
Years: 1970-1974
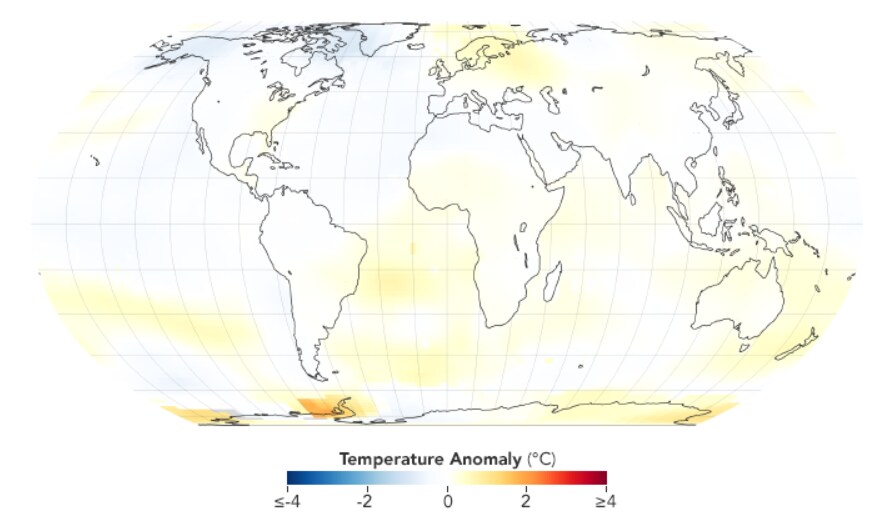
Years: 1975-1979
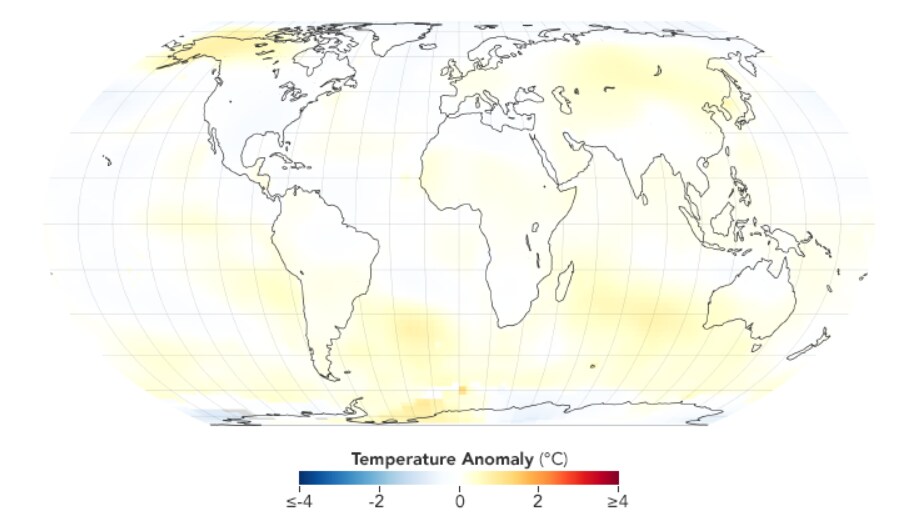
Years: 1980-1984
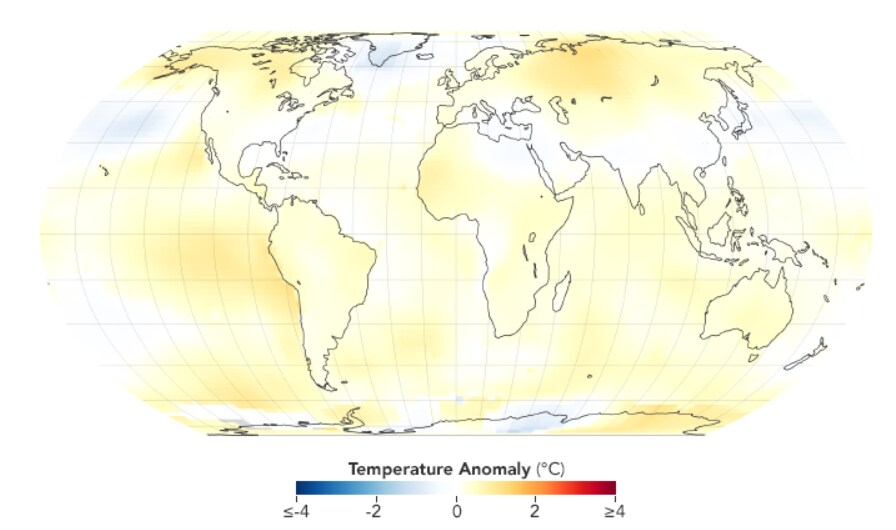
Years: 1985-1989
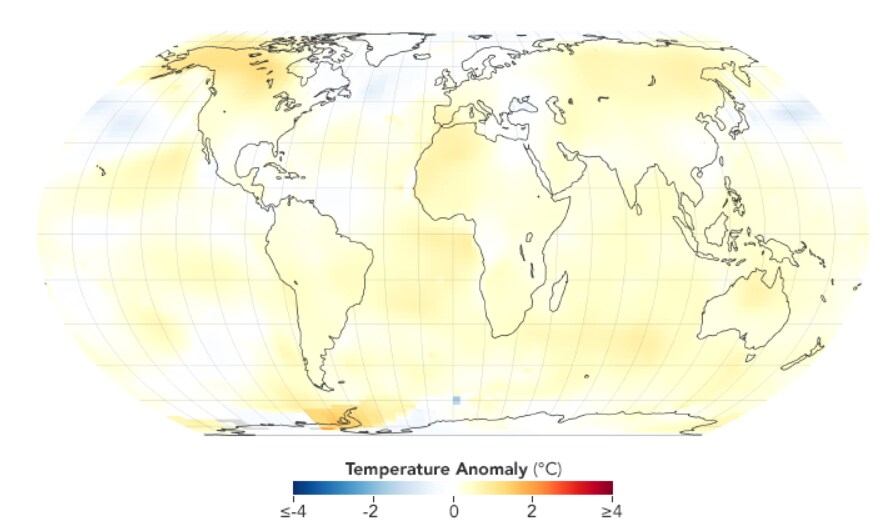
Years: 1990-1994
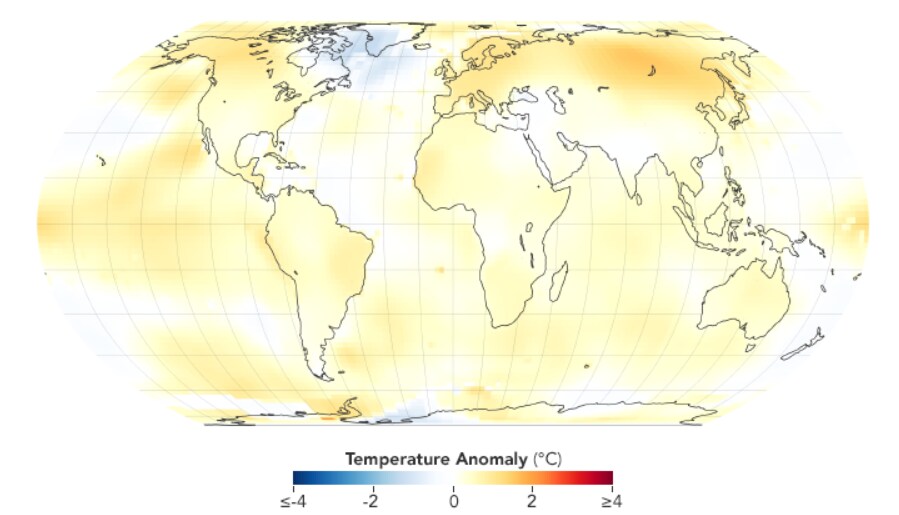
Years: 1995-1999
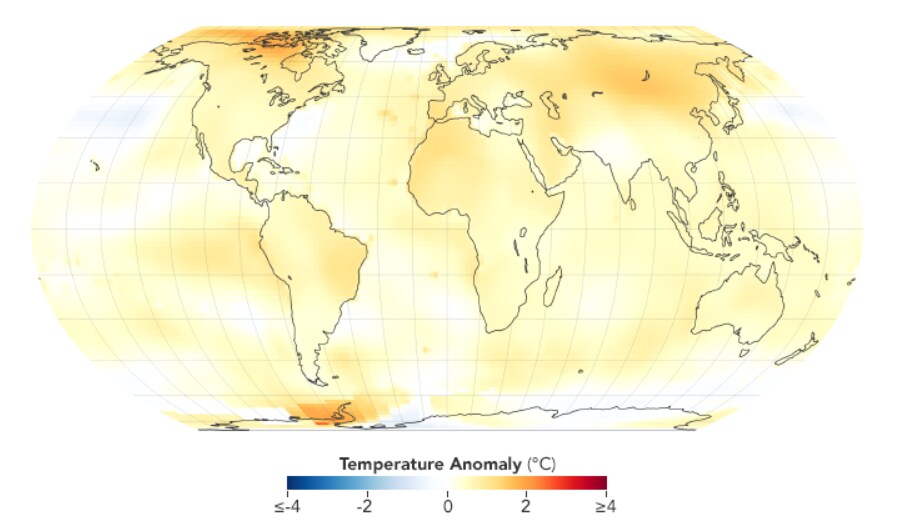
Years: 2000-2004
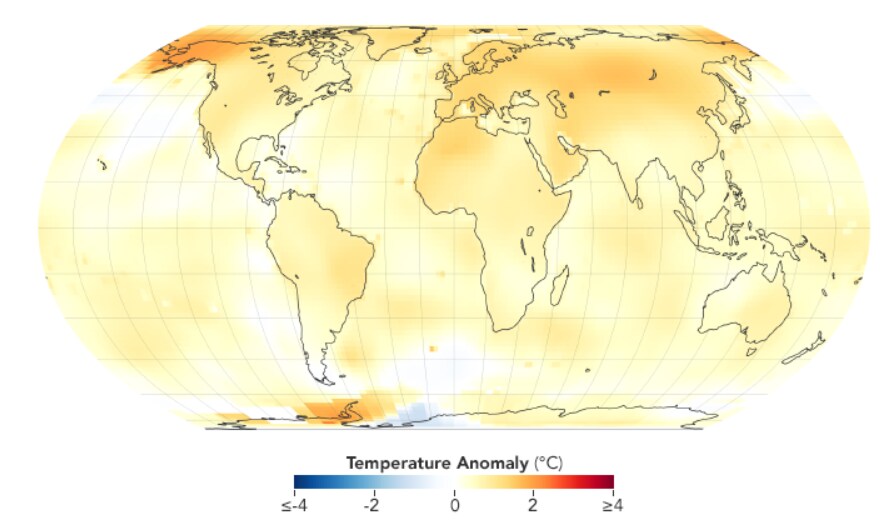
Years: 2005-2009
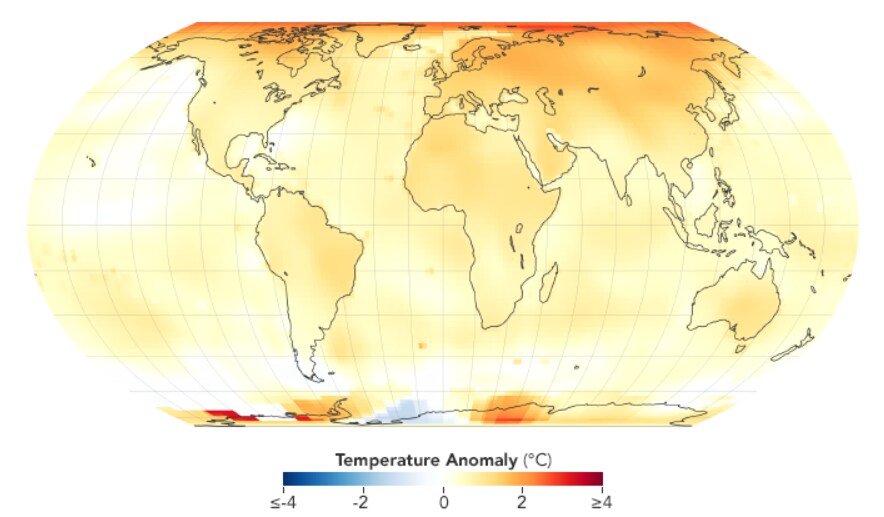
Years: 2010-2014
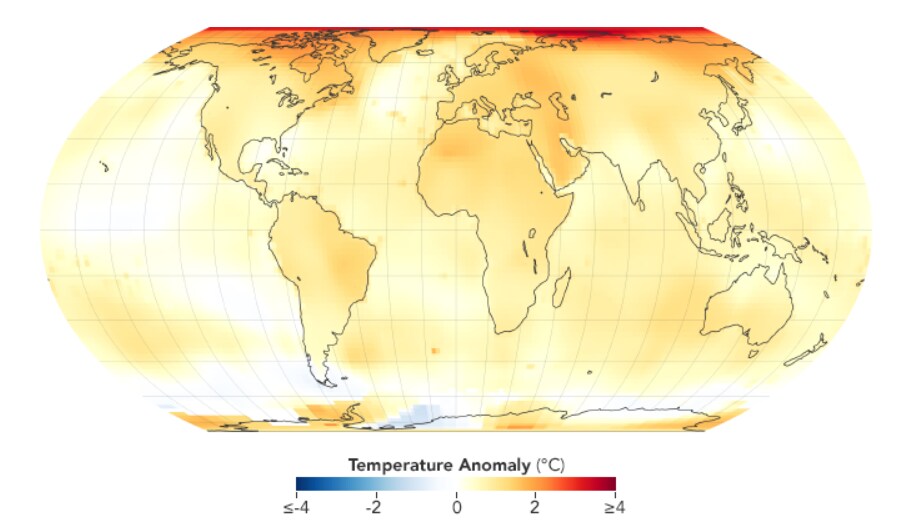
Years: 2015-2019
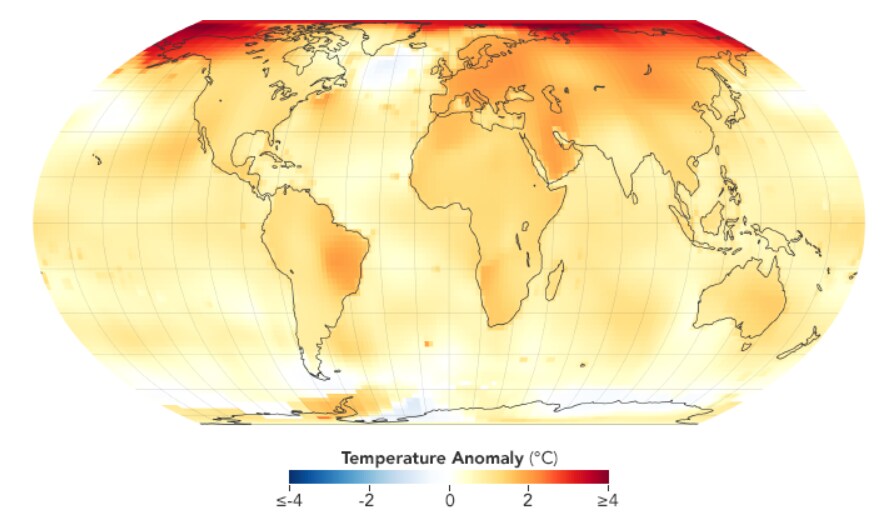
Year: 2021