It’s been said that a picture is worth a thousand words.
When Ed Hawkins, a professor of climate science at Reading University in the UK, wanted to find the simplest way to tell the story of global warming, he turned to an image.
His climate stripes graphic shows how average temperatures have risen over more than a century, going from dark blue to dark red. It paints a stark and unmistakable picture of how our planet is heating up.
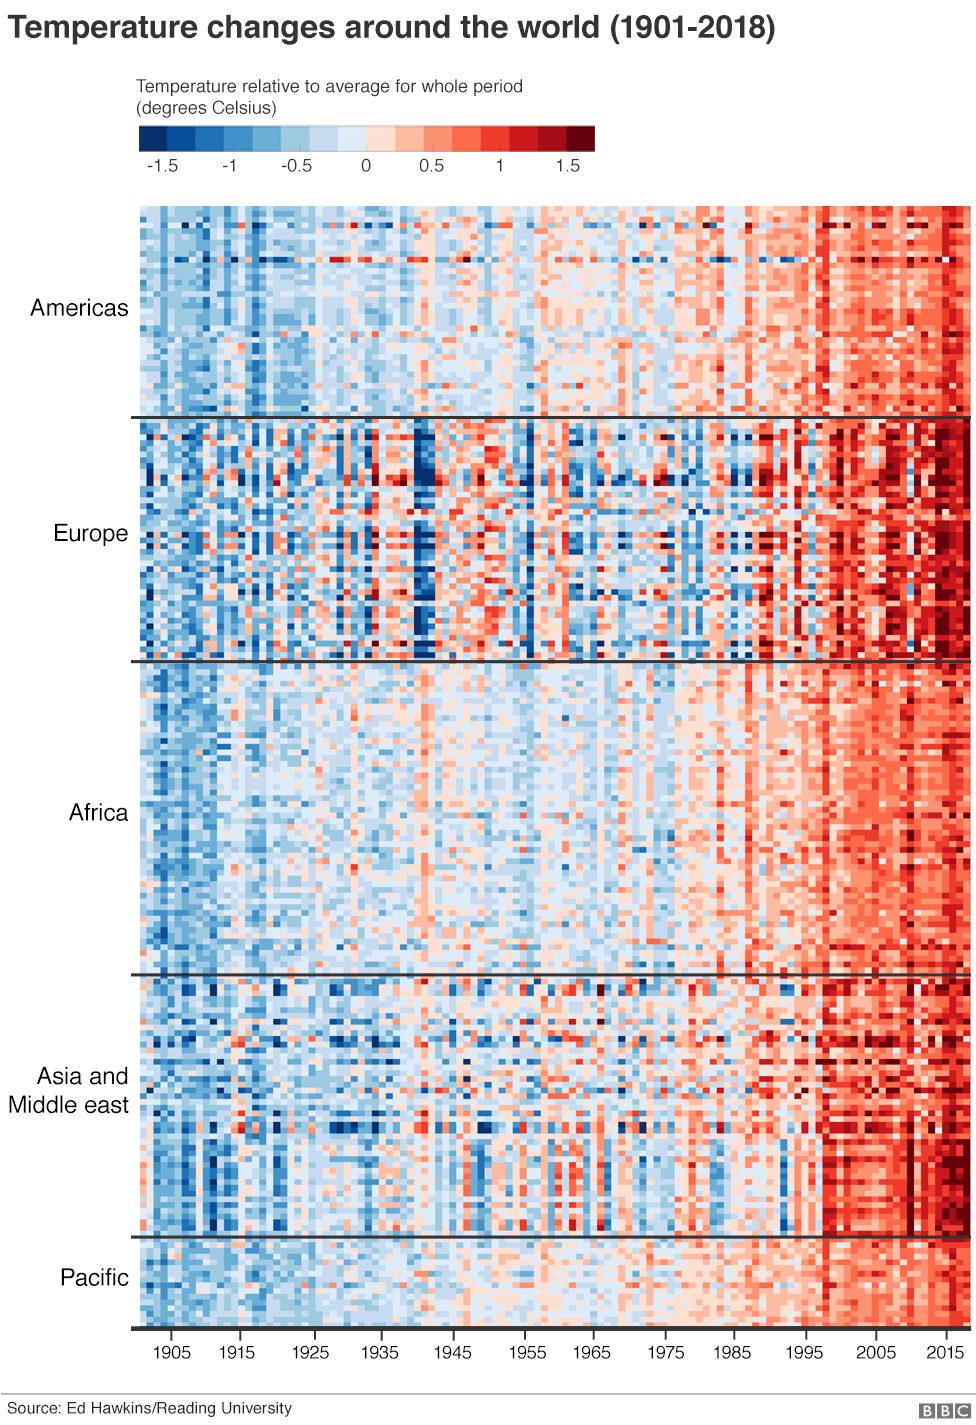
The image has been made available as a download from Prof. Hawkins’ website. And it’s begun to take on a life of its own, appearing on T-shirts and other items of clothing, along with the hashtag #ShowYourStripes.
Someone even painted their Tesla electric car in the climate stripes pattern.
"What I've learnt from this is that you don't need the numbers to get the message across. The colours will do that," Prof. Hawkins told BBC News.
How is the World Economic Forum facilitating the transition to clean energy?
The Centre for Energy and Materials connects leaders to make sense of the complex transitions reshaping energy, materials and industrial systems. It provides a platform to explore how energy security, affordability and sustainability intersect.
Through collaboration across value chains and regions, the Centre enables shared pathways that help partners align around practical solutions for a secure, low-carbon and equitable transition.