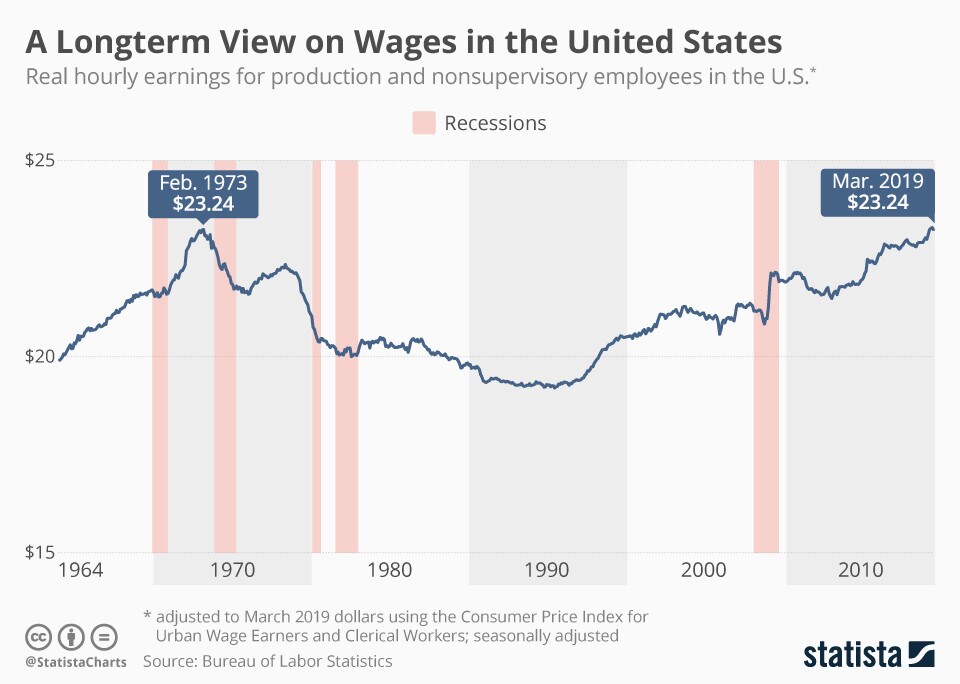
The U.S. Bureau of Labor Statistics released its March 2019 update on real wages in the United States on Wednesday, reporting a -0.2 percent drop in real average hourly earnings for production and nonsupervisory employees compared to February and a 1.6 percent increase compared to March 2018. Denominated in constant 1982-1984 dollars, average hourly wages dropped from $9.40 in February to $9.38 in March, with average weekly earnings amounting to $315.98.
Since it’s hard to grasp the value of $9.38 in 1982 from today’s point of view, we took the liberty of calculating real wages in today’s prices and taking a look at what wages from 1964 onwards would be worth today. As the following chart shows, today’s wages in the United States are at a historically high level with average hourly earnings in March 2019 amounting to $23.24 in 2019 dollars. Coincidentally that matches the longtime peak of March 1974, when hourly wages adjusted to 2019 dollars amounted to exactly the same sum.