There's a global movement to encourage cities to grow more trees and plan more parks. On Wednesday, this year's International Day of Forests encourages urban areas to invest in green spaces.
To get a clearer picture of which cities have the most tree coverage today, MIT's Senseable Lab partnered with the World Economic Forum (WEF) to create Treepedia, a site with interactive maps that show the density of greenery in major cities around the world.
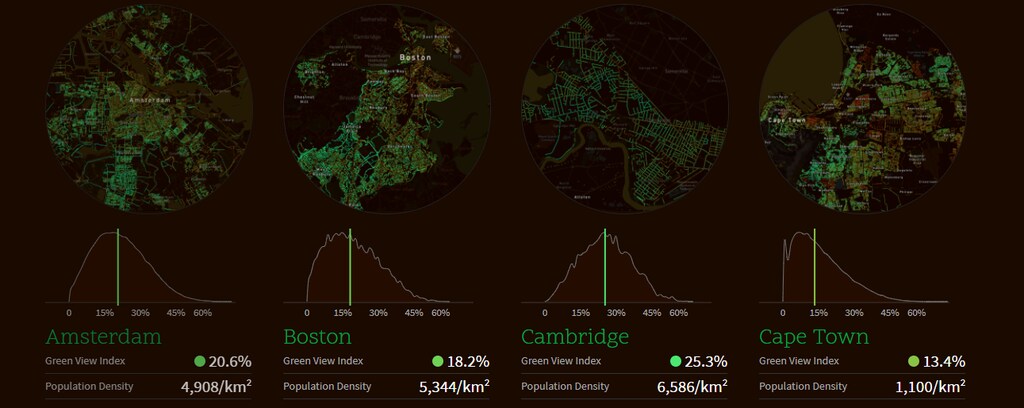
The researchers used information from Google Street View to determine what they call the "Green View Index," a rating that quantifies each city's percentage of canopy coverage based on aerial images. When it launched in 2016, Treepedia featured 10 cities, but the team has since added more to its list.
The goal of Treepedia is to make make urban planning more accessible to those outside the field, MIT's Carlo Ratti said in a statement.
Check out which cities boast the highest Green View Indexes below.
19. Los Angeles, California — 15.2%
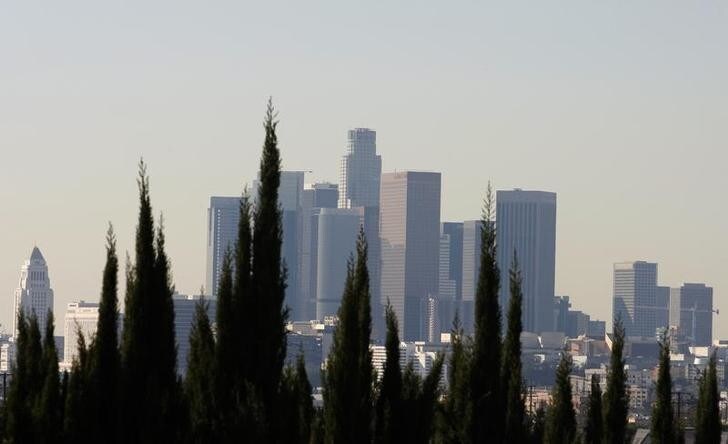
Check out the interactive map of Los Angeles
18. Turin, Italy — 16.2%
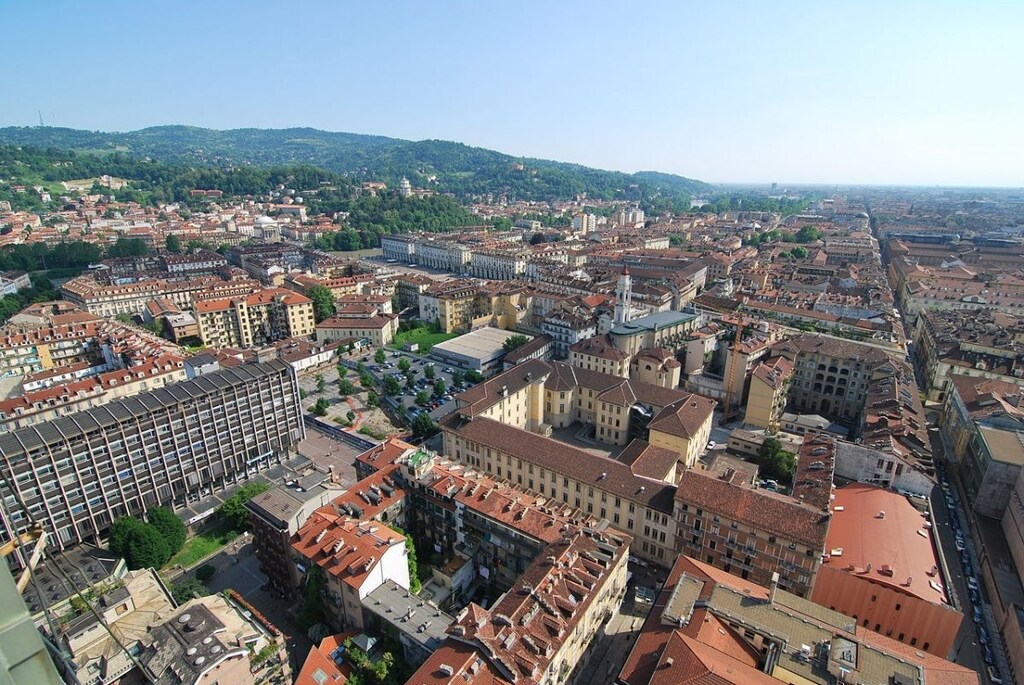
Check out the interactive map of Turin
17. Tel Aviv, Israel — 17.5%
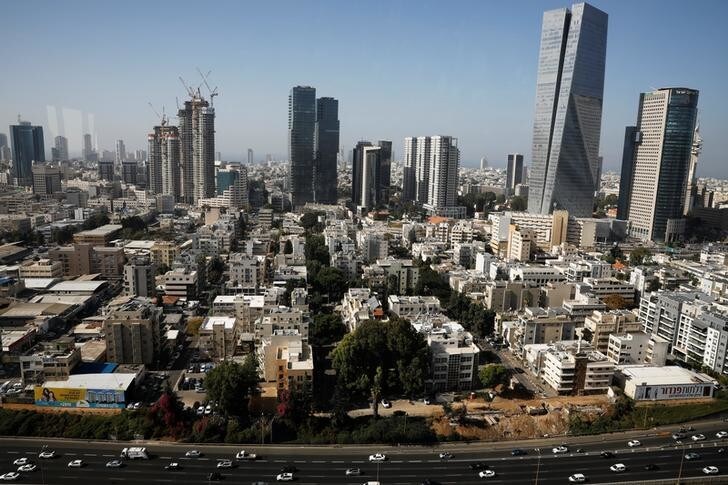
Check out the interactive map of Tel Aviv
16. Boston, Massachusetts — 18.2%
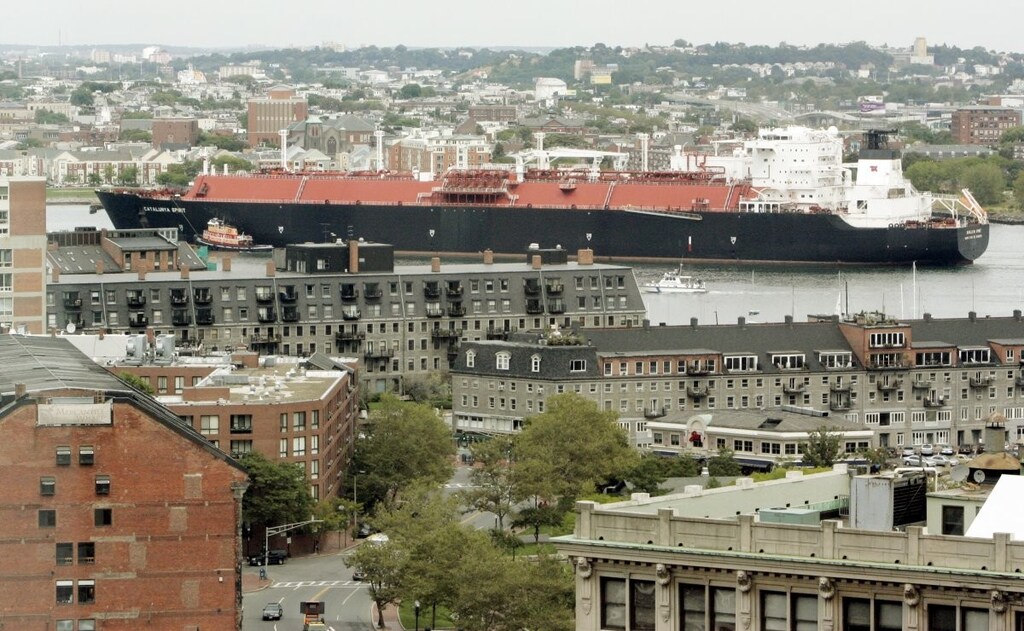
Check out the interactive map of Boston
15. Miami, Florida — 19.4%
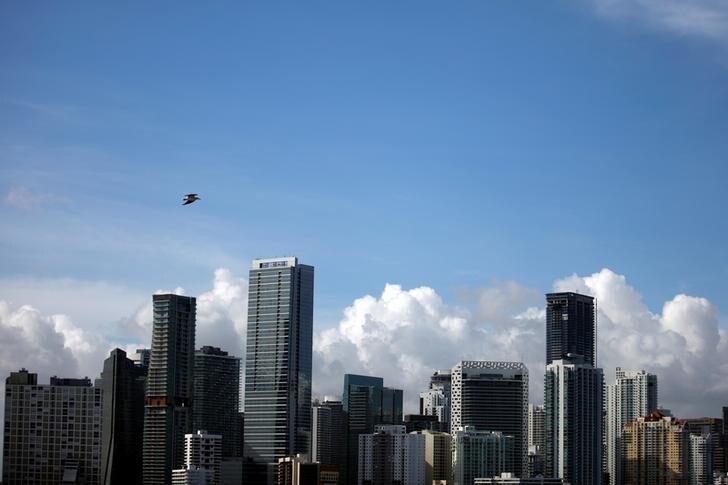
Check out the interactive map of Miami
14. Toronto, Canada — 19.5%
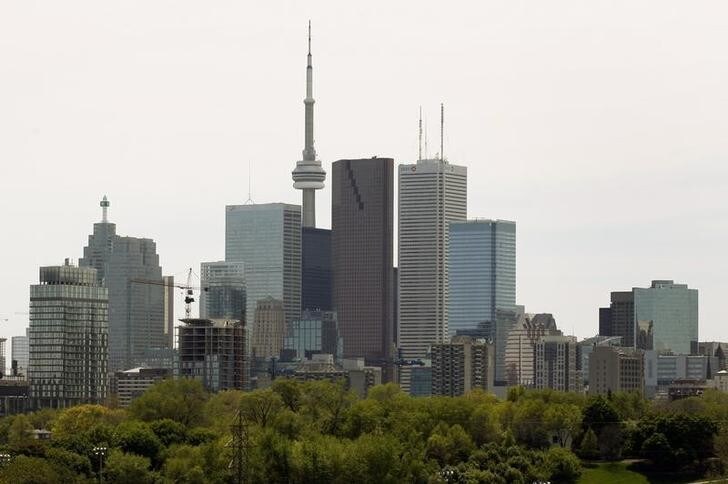
Check out the interactive map of Toronto
13. Seattle, Washington — 20%
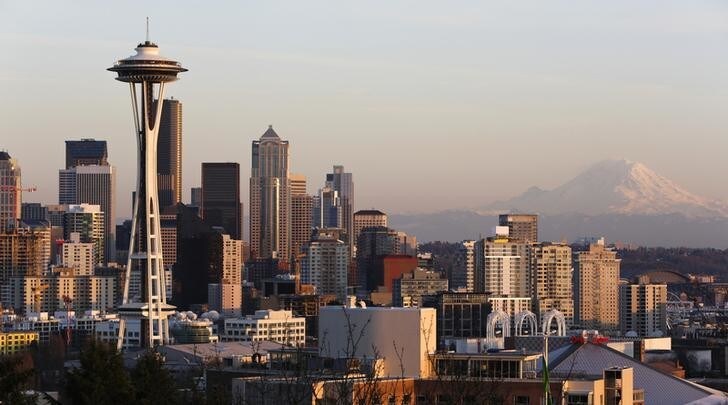
Check out the interactive map of Seattle
12. Amsterdam, Netherlands — 20.6%
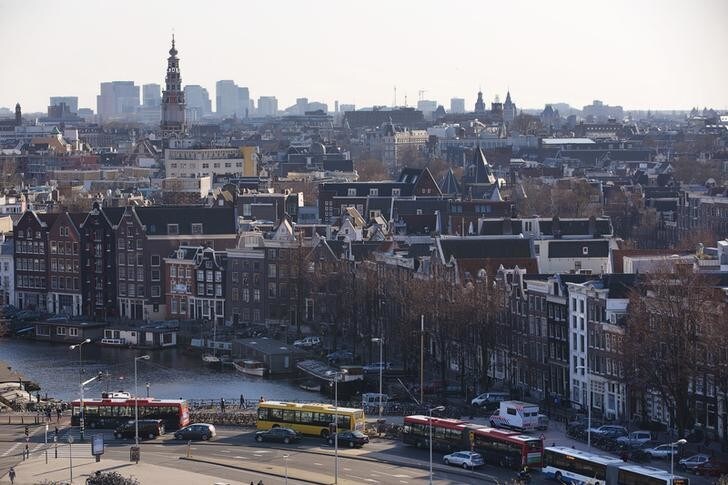
Check out the interactive map of Amsterdam
11. Geneva, Switzerland — 21.4%
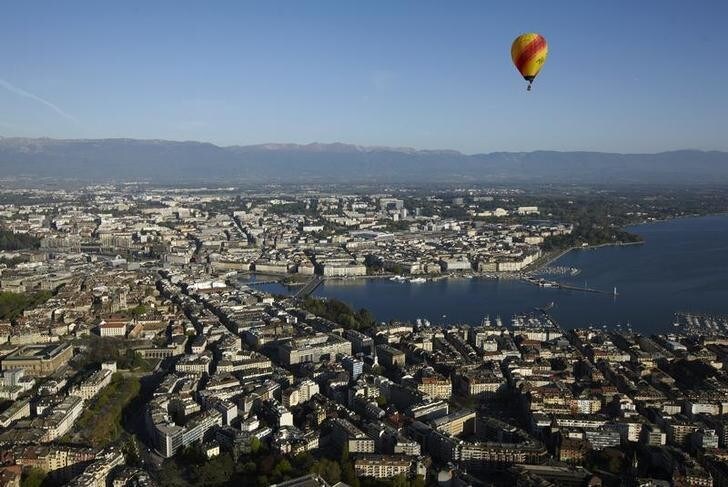
Check out the interactive map of Geneva
10. Frankfurt, Germany — 21.5%
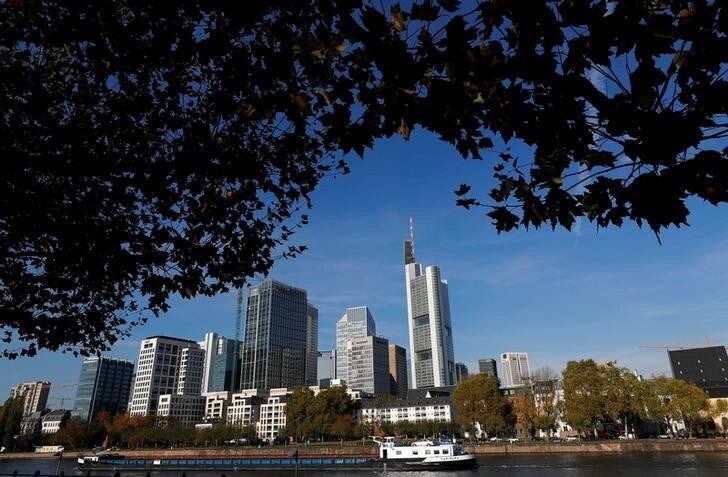
Check out the interactive map of Frankfurt
9. Sacramento, California — 23.6%

Check out the interactive map of Sacramento
8. Johannesburg, South Africa — 23.6%
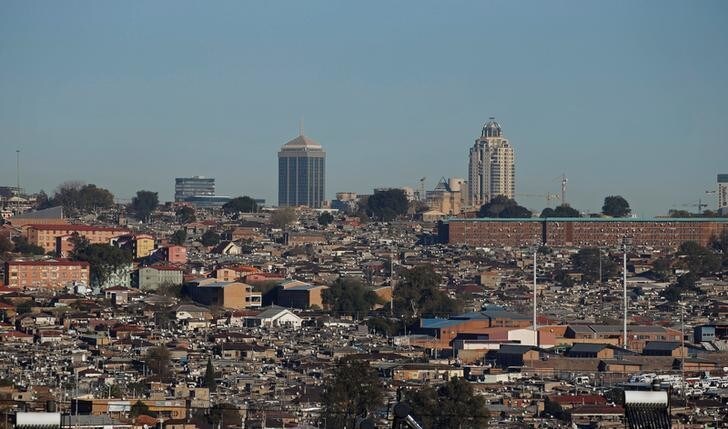
Check out the interactive map of Johannesburg
7. Durban, South Africa — 23.7%
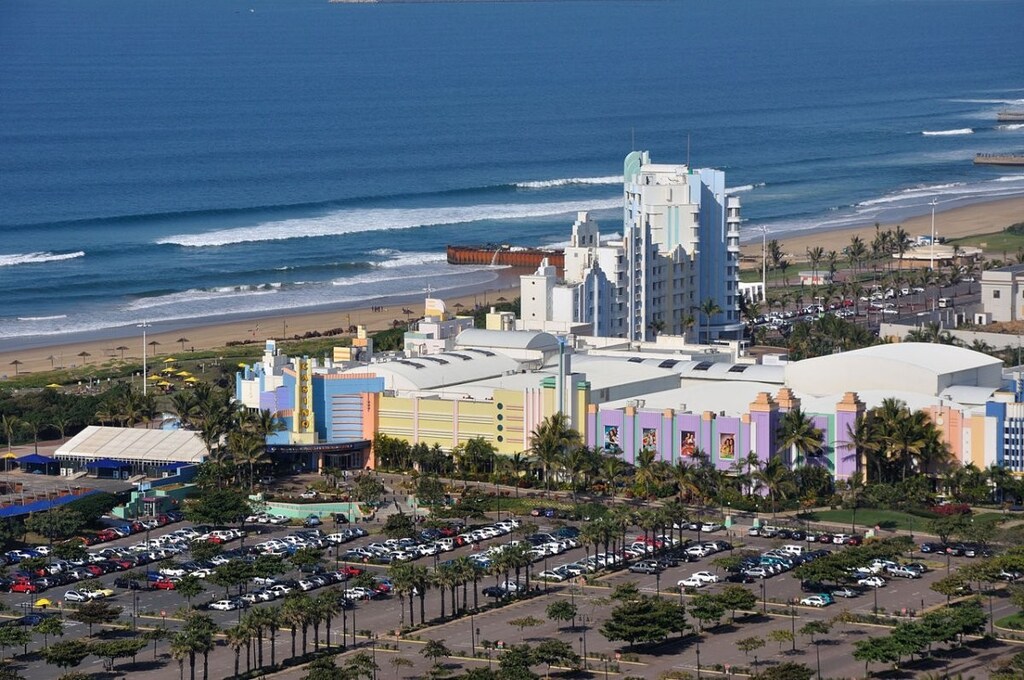
Check out the interactive map of Durban
6. Montreal, Canada — 25.5%
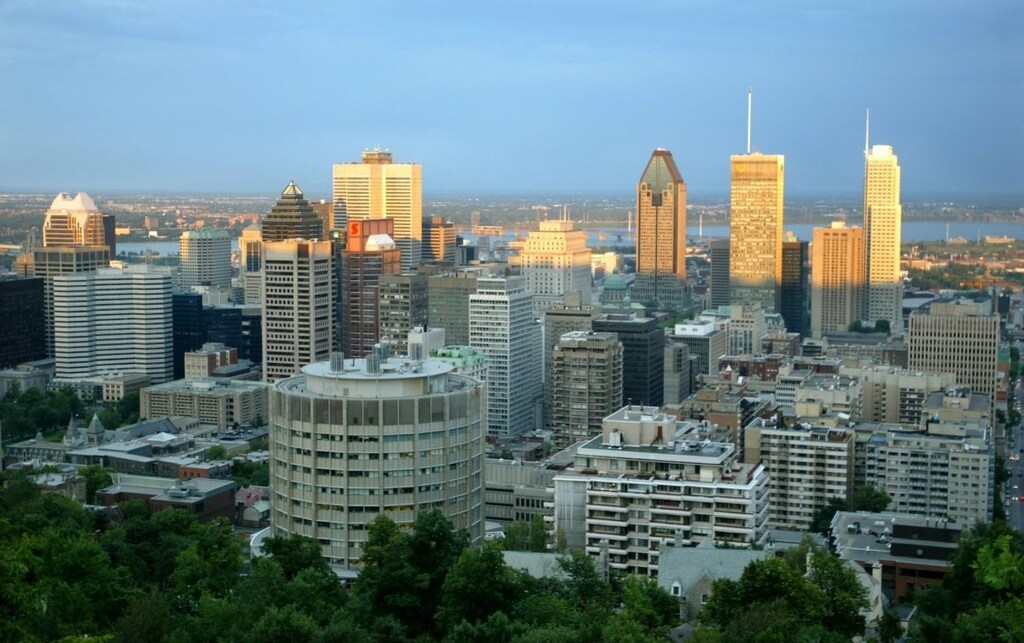
Check out the interactive map of Montreal
5. Sydney, Australia – 25.9%
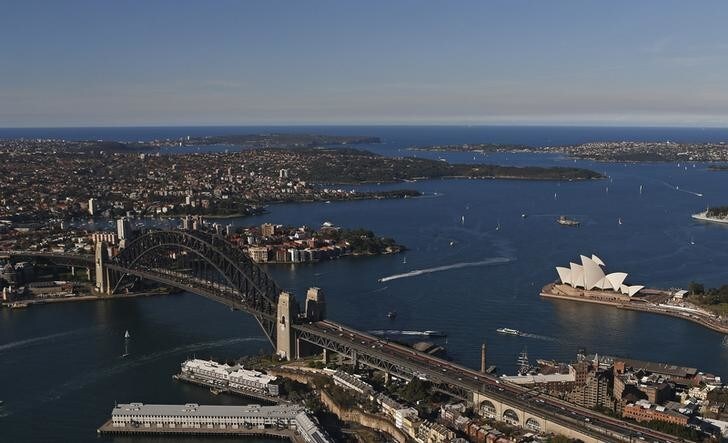
Check out this interactive map of Sydney
4. Vancouver, Canada — 25.9%
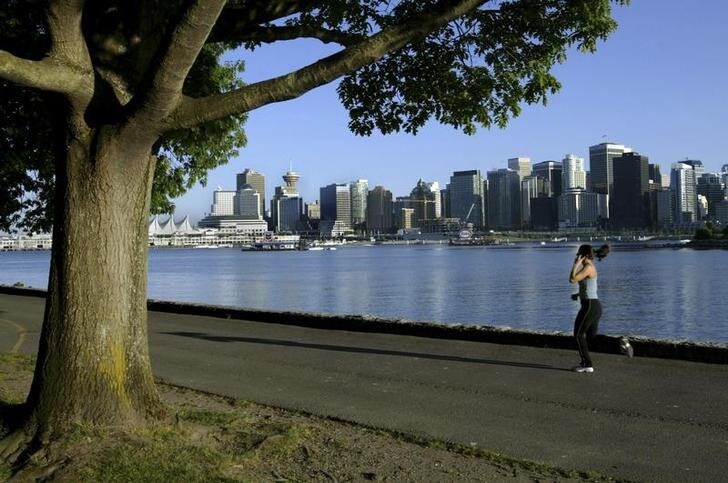
Check out the interactive map of Vancouver
3. Oslo, Norway — 28.8%
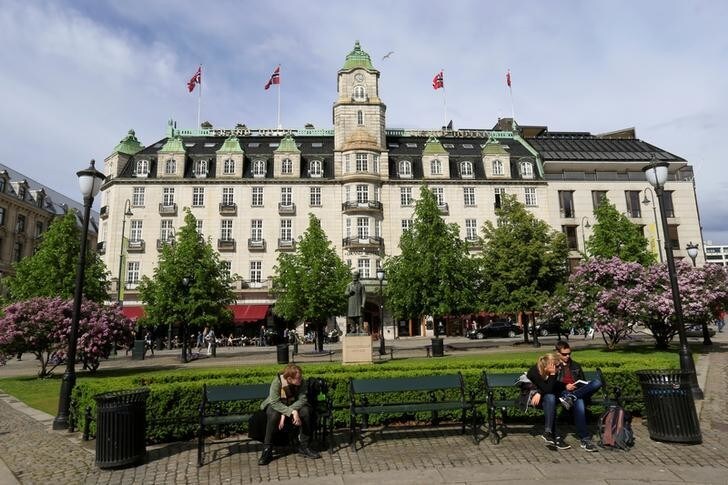
Check out the interactive map of Oslo
2. Singapore — 29.3%
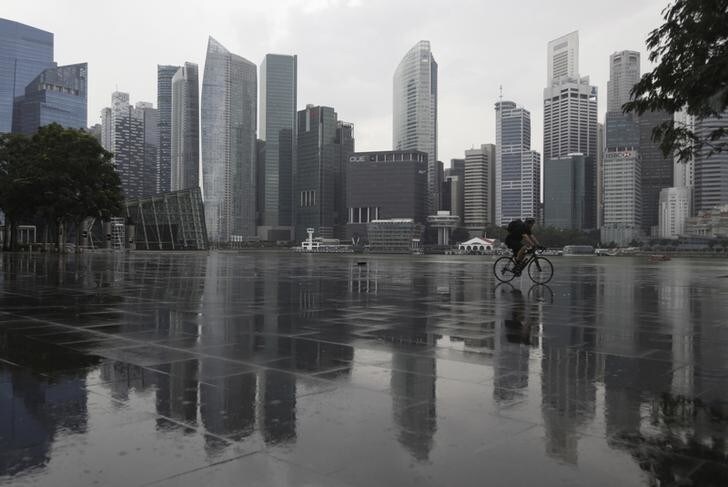
Check out the interactive map of Singapore
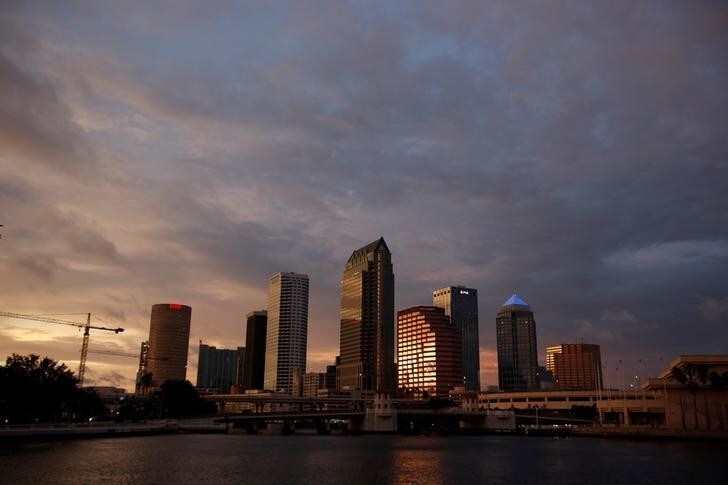
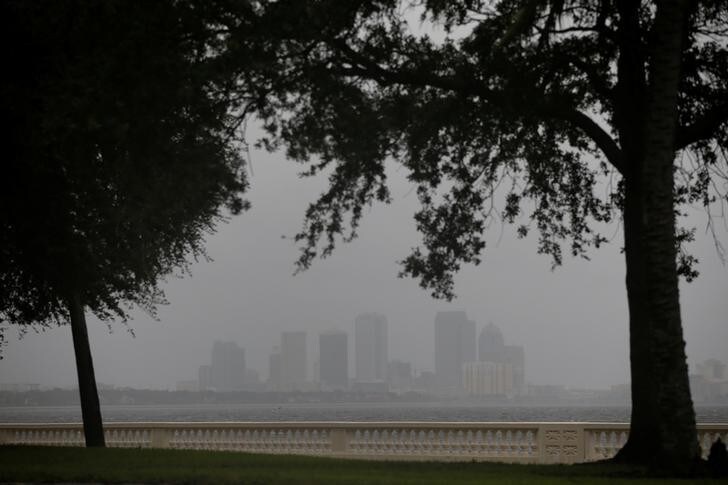
1. Tampa, Florida — 36.1%