


Connecting leaders to make sense of global challenges and move the world forward together
More about the ForumWatch full video
How we drive impact
About the Centres
We tackle global challenges through our 11 Centres
Our Centre teams convert ambition into focused action through structured initiatives and insight generation.
More about our Centres


Latest analysis on war in the Middle East
Iran war: How has China's energy transition been impacted?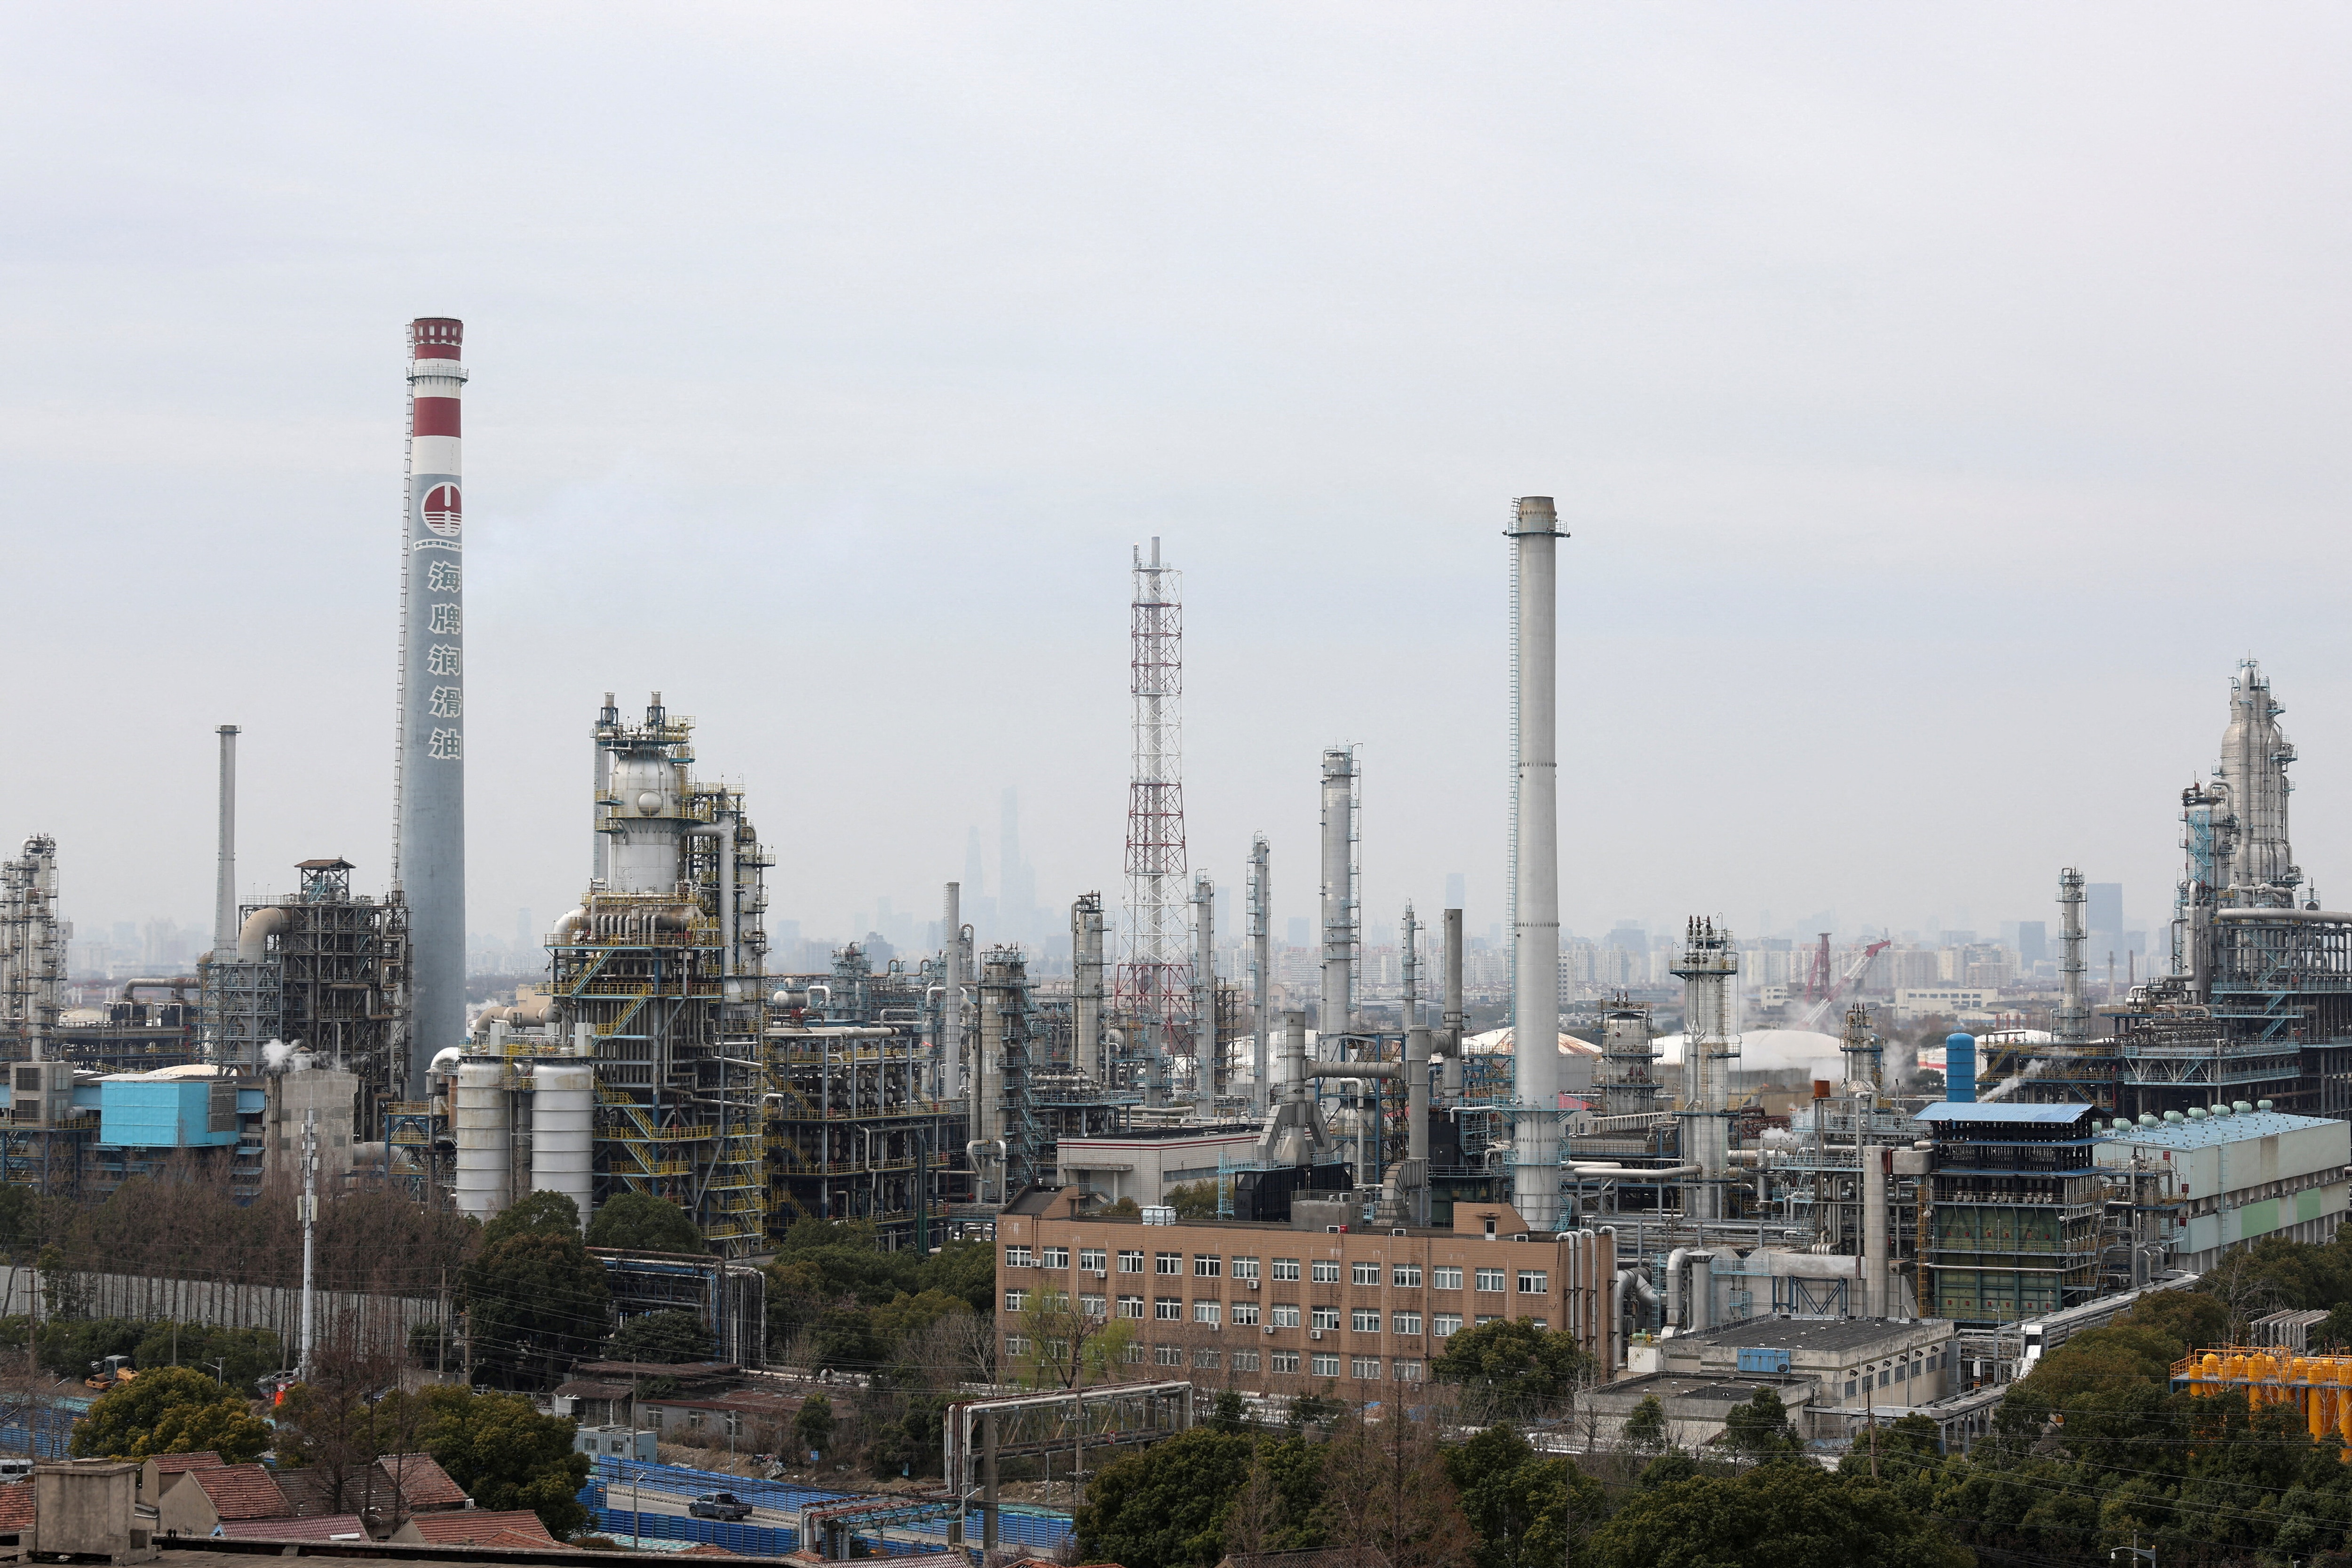

Iran war: How has China's energy transition been impacted?
6 min read

Conflict in the Middle East is impacting aviation – here’s how sustainable aviation fuels can help

Conflict in the Middle East is impacting aviation – here’s how sustainable aviation fuels can help
6 min read
How is war in the Middle East reshaping Asia’s energy transition?

How is war in the Middle East reshaping Asia’s energy transition?
6 min read
Middle East war: 6 ways countries are responding to the historic energy shock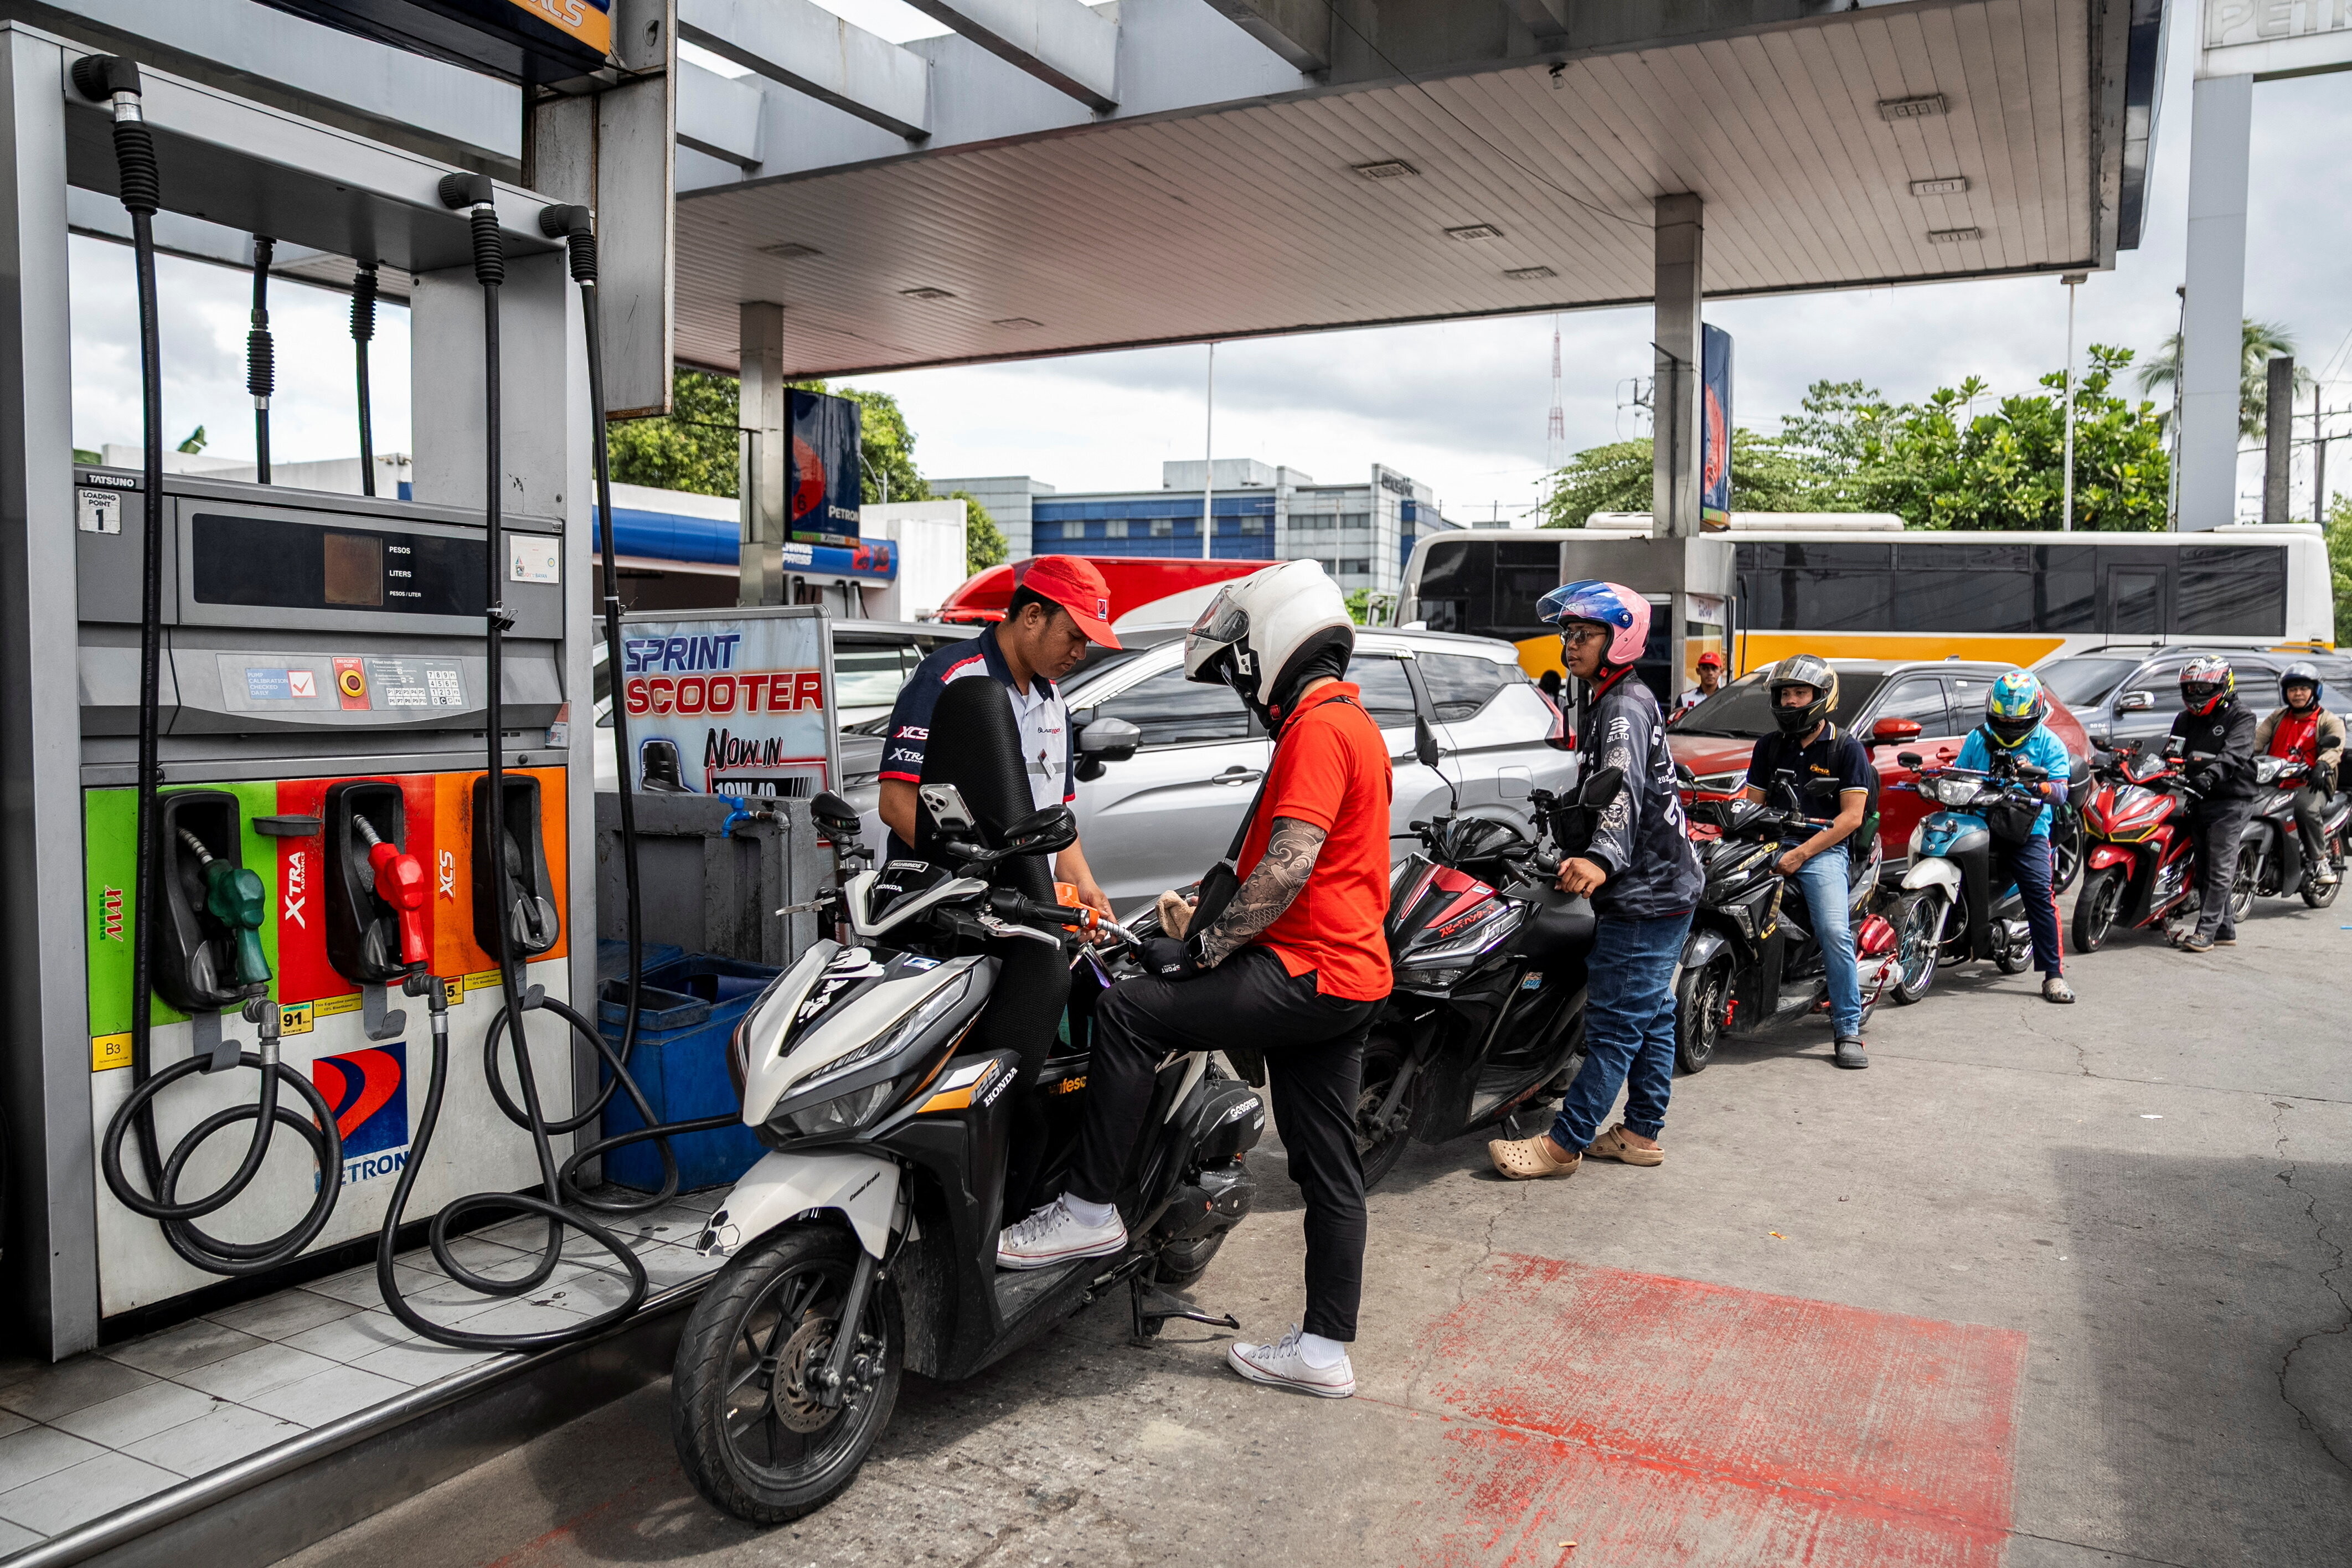

Middle East war: 6 ways countries are responding to the historic energy shock
5 min read
How war in the Middle East is turning governments into insurers of last resort
How war in the Middle East is turning governments into insurers of last resort
6 min read
Cease-fire or not, we’ll feel the economic effects of this war for a while

Cease-fire or not, we’ll feel the economic effects of this war for a while
7 min read
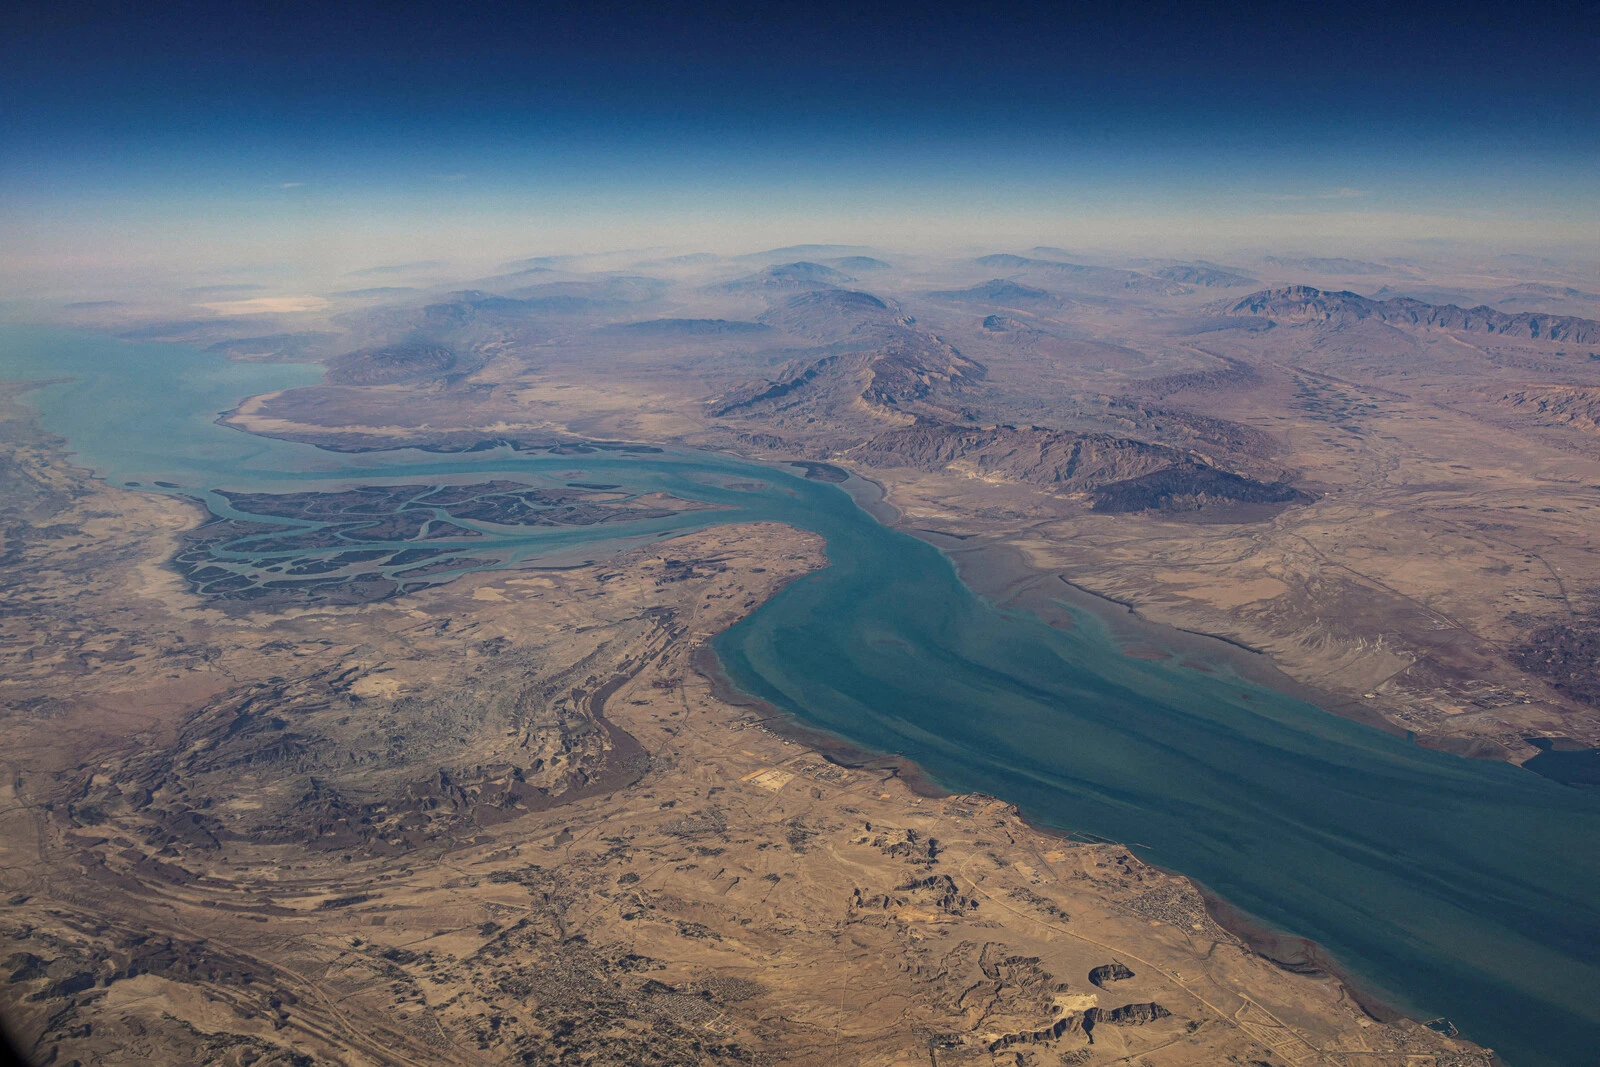
How did the Strait of Hormuz become so important, and will it stay that way?

How did the Strait of Hormuz become so important, and will it stay that way?
5 min read
How is war reshaping the global economy? 4 chief economists explain
How is war reshaping the global economy? 4 chief economists explain
5 min read
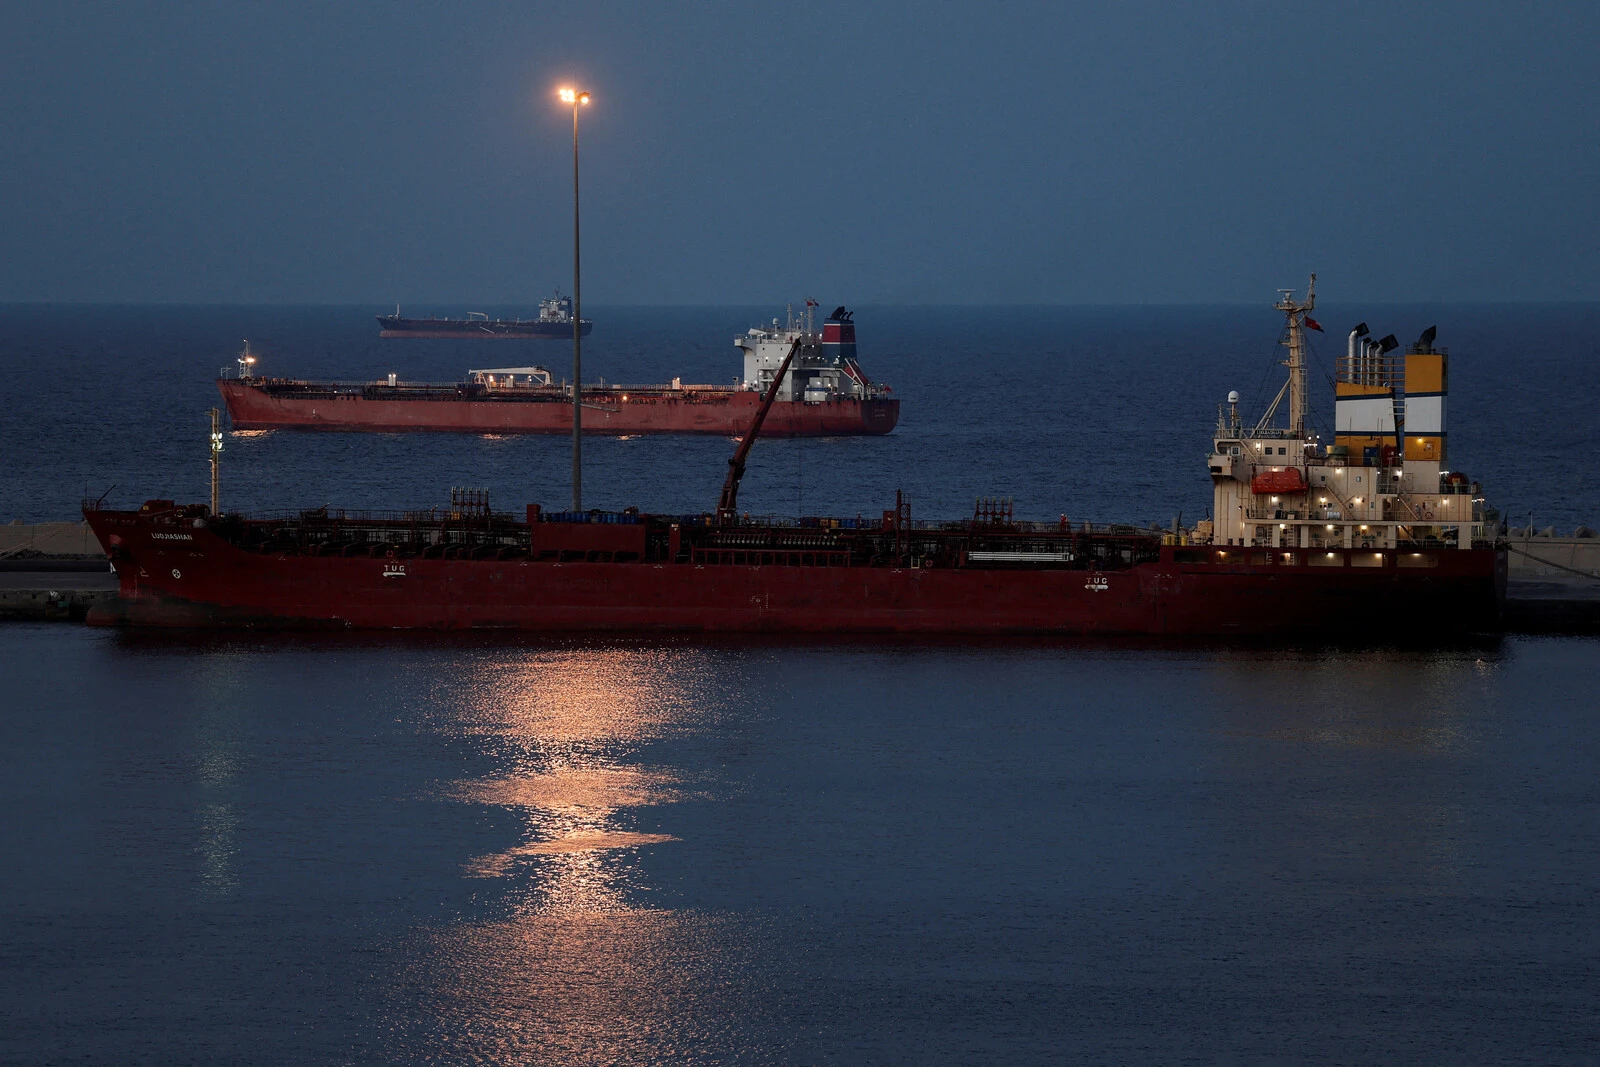
The Strait of Hormuz crisis affects more than just oil. Here are 9 other commodities 

The Strait of Hormuz crisis affects more than just oil. Here are 9 other commodities
6 min read
How the Middle East war reshapes the global cybersecurity landscape

How the Middle East war reshapes the global cybersecurity landscape
5 min read
How war in the Middle East has exposed the vulnerability of global choke points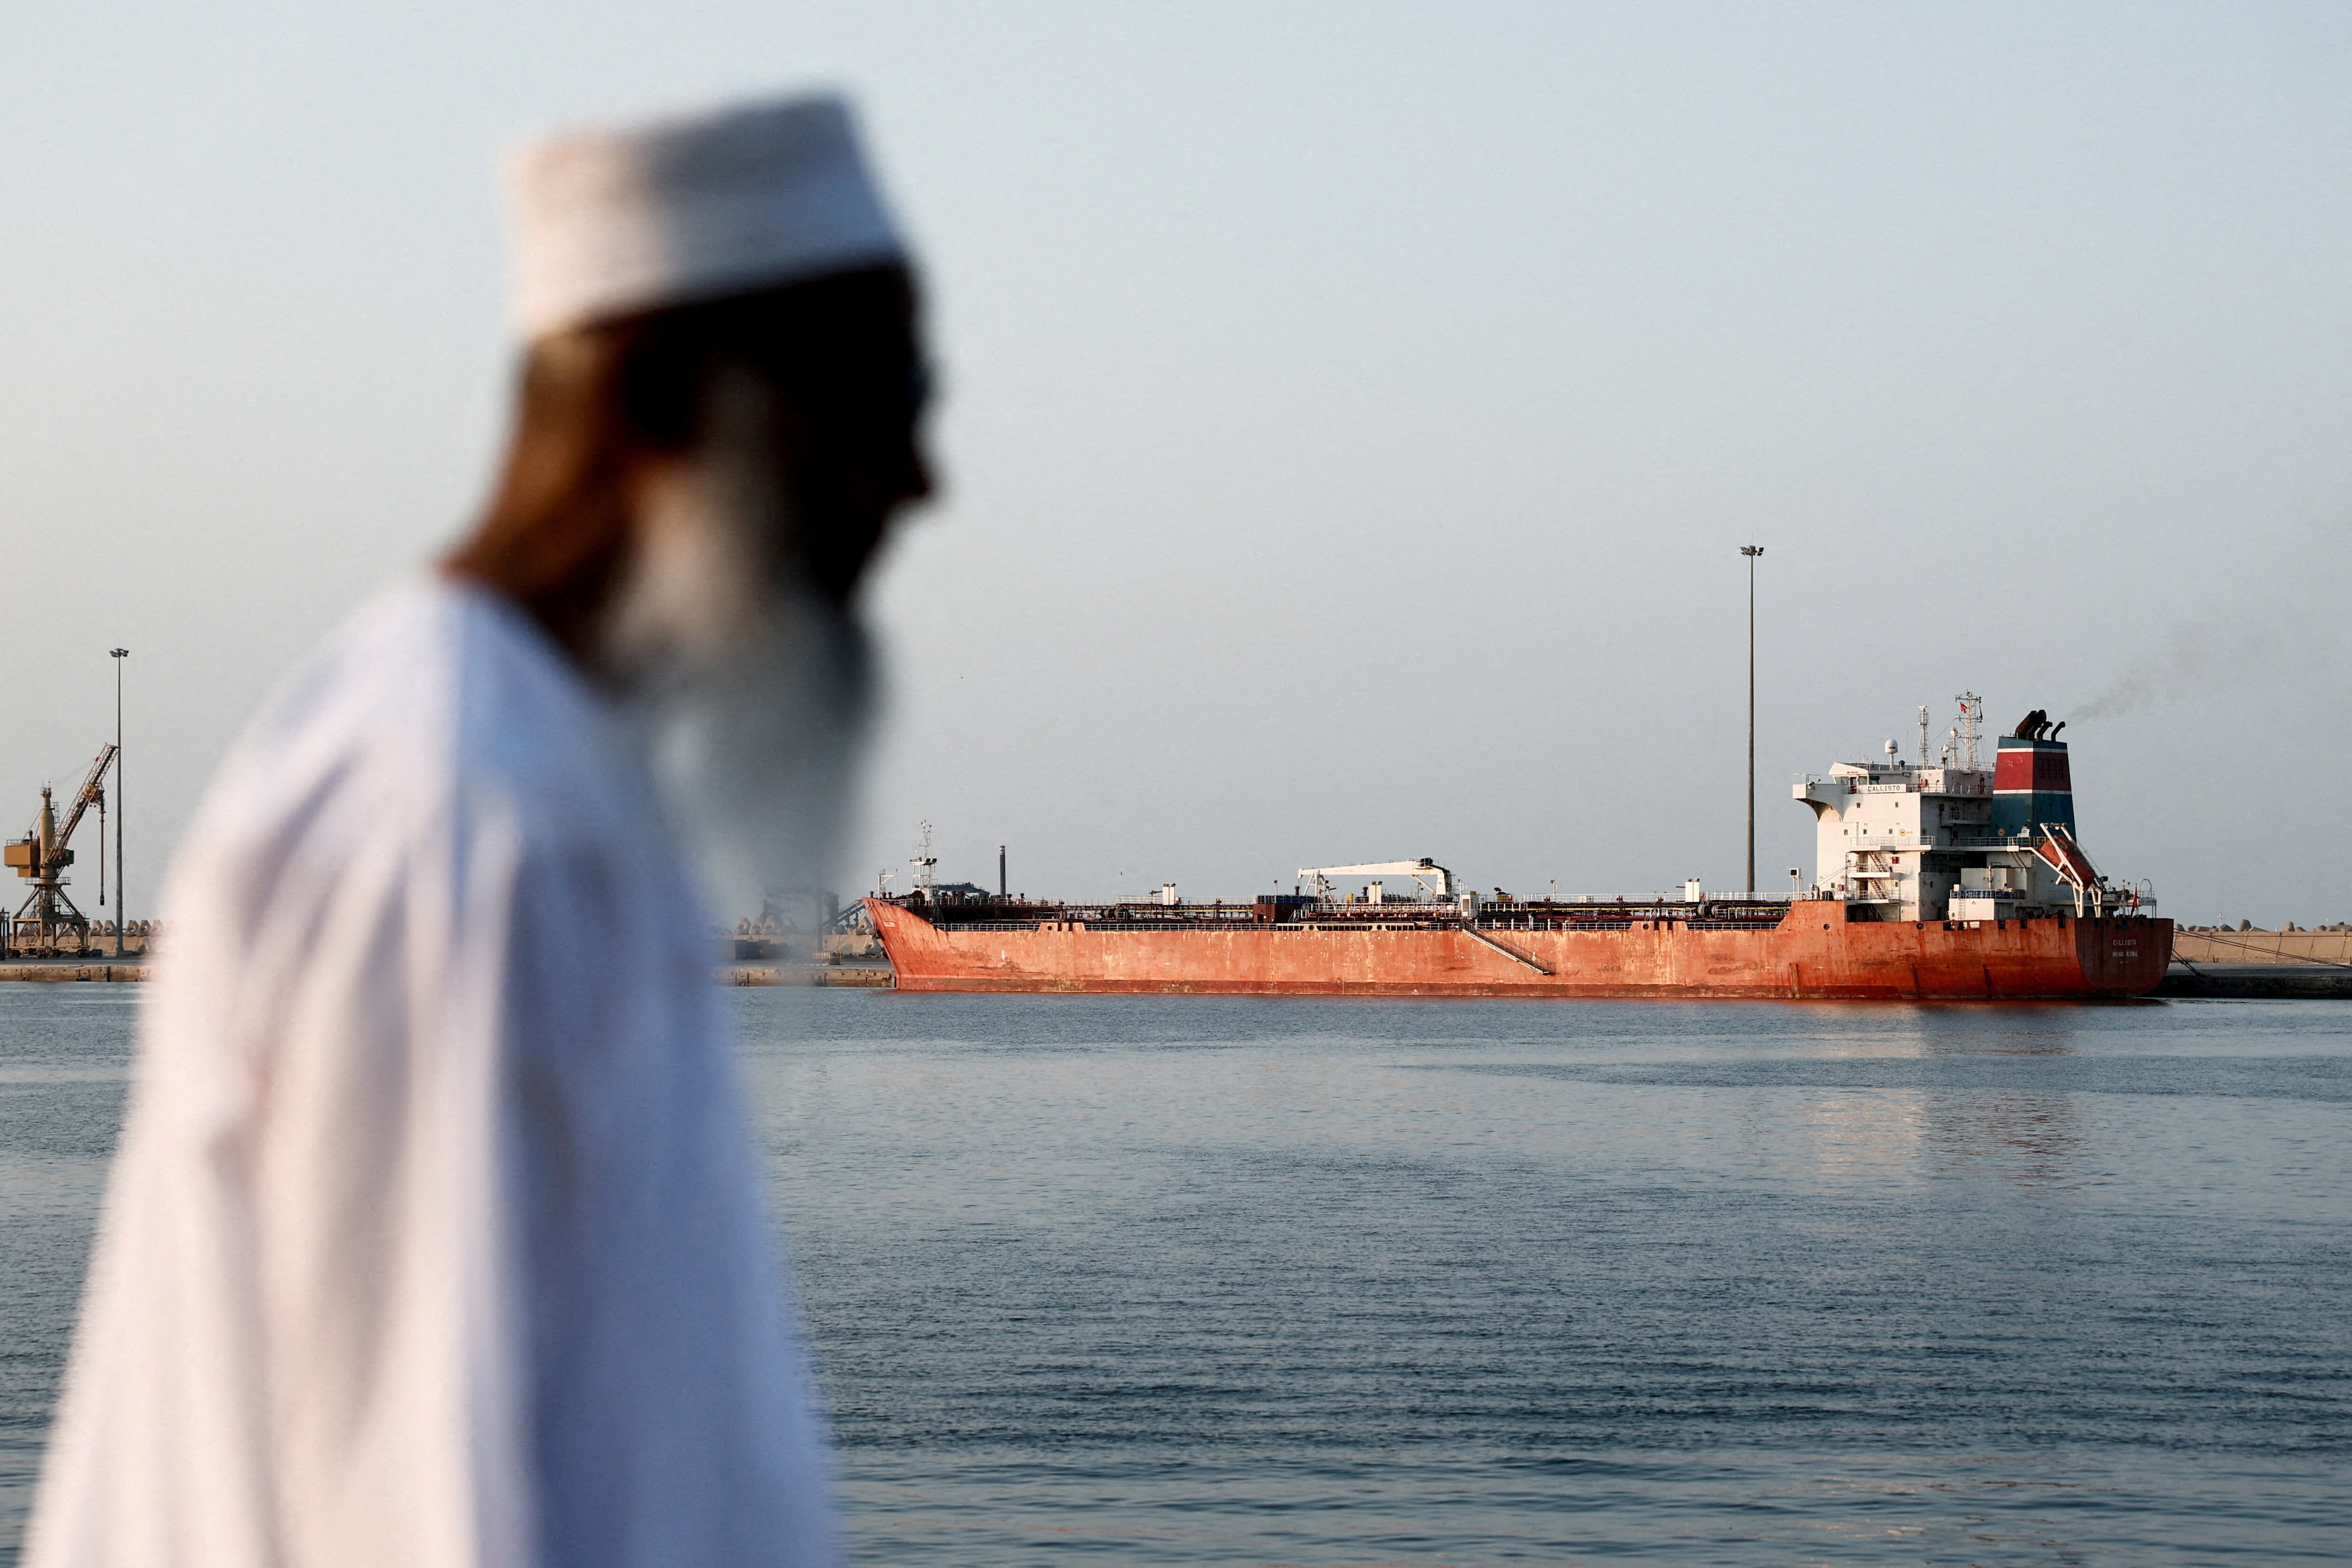

How war in the Middle East has exposed the vulnerability of global choke points
8 min read


Forum Stories newsletter
Bringing you weekly curated insights and analysis on the global issues that matter.
Bringing you weekly curated insights and analysis on the global issues that matter.
Forum in the news
Forum’s digital initiatives
Join our movement to source and scale purpose-driven start-ups working to solve the world's biggest challenges.
Discover more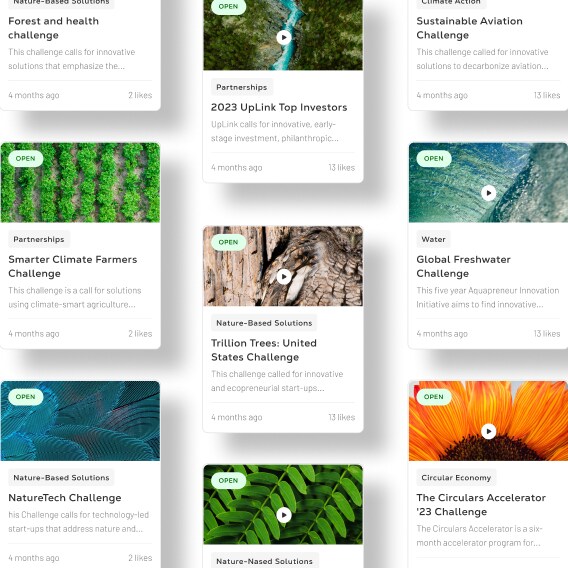
Explore and monitor the issues and forces driving transformational change across economies, industries, and global issues.
Discover more