Which EU country has the most citizens emigrating to the US?


Get involved with our crowdsourced digital platform to deliver impact at scale
Stay up to date:
United States
In the period between 1998 and 2013, an average of 61 649 EU nationals received lawful permanent resident status in the US each year. Lawful permanent residency, also referred to as “a green card”, gives immigrants basically the same rights as US citizens (with the exception of the right to vote) for life. Most importantly, a green card allows immigrants to work for any US company or set up their own company in the US.
The European Union’s share in worldwide immigration to the US is quite small. In 2013, 54 356 EU nationals received green card status in the US. This represents only 0.01% of the total EU population in 2013 and 5.5% of all green cards issued by the US in that year. These numbers have been somewhat higher in the past (see figure 1).
FIGURE 1

Source: Bruegel calculations based on the Yearbook of Immigration Statistics, US Department of Homeland Security
The following figures show where these EU immigrants to the US come from. We have divided the EU into four regions.
- East: Bulgaria, Croatia, Czech Republic, Estonia, Hungary, Latvia, Lithuania, Poland, Romania, Slovakia, and Slovenia
- North: Austria, Belgium, Denmark, Finland, France, Germany, Luxembourg, the Netherlands, and Sweden
- South: Cyprus, Greece, Italy, Malta, Portugal, and Spain
- West: Ireland and the United Kingdom.
Figure 2 compares the regions’ shares in EU-US immigration to their shares in total EU population (we consider the averages of the period between 2010 and 2013). We see that most of EU immigration to the US comes from Eastern Europe. Note that the share of the East in immigration is substantially higher than its share in population. This shows that their contribution to immigration is disproportionally high compared to those of the other regions. The North displays the opposite phenomenon; it is responsible for only a small portion of EU-US immigration considering its large share in EU population. The same applies for Southern European countries. Now consider Western Europe. The United Kingdom and Ireland are overrepresented in EU to US immigration; their share in immigration is twice as high as their share in population.
FIGURE 2

Source: Bruegel calculations based on the Yearbook of Immigration Statistics, US Department of Homeland Security
When we examine trends over time (1998-2013), we see a gradual decline, especially since 2006, in the absolute number of immigrants from Eastern Europe. This is reflected in a decline in the East’s share in total EU immigration to the US. Figure 3 below shows the regions’ shares in total EU-US immigration and how those shares have changed since 1998.
FIGURE 3
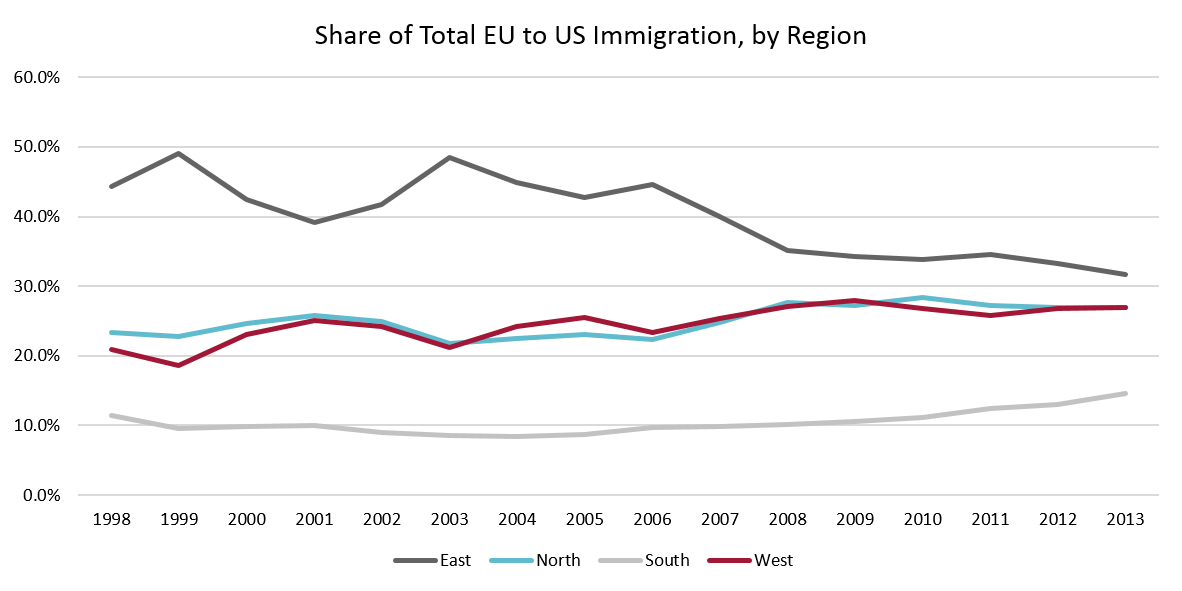
Source: Bruegel calculations based on the Yearbook of Immigration Statistics, US Department of Homeland Security
The following graph (Figure 4) looks at individual EU countries. The countries with the greatest overrepresentation in green card numbers (given their relatively small shares in population) are Bulgaria, Ireland, and Lithuania, with shares in immigration three times higher than their shares in population. Estonia, Latvia, Poland, and Romania also have immigration rates higher than what their population size would predict. But the most striking example is the United Kingdom, whose share in immigration is almost twice as high as its share in population, despite its large share in total EU population. The low immigration to population ratio in the South holds for all South European countries and is especially noticeable in Spain and Italy.
FIGURE 4
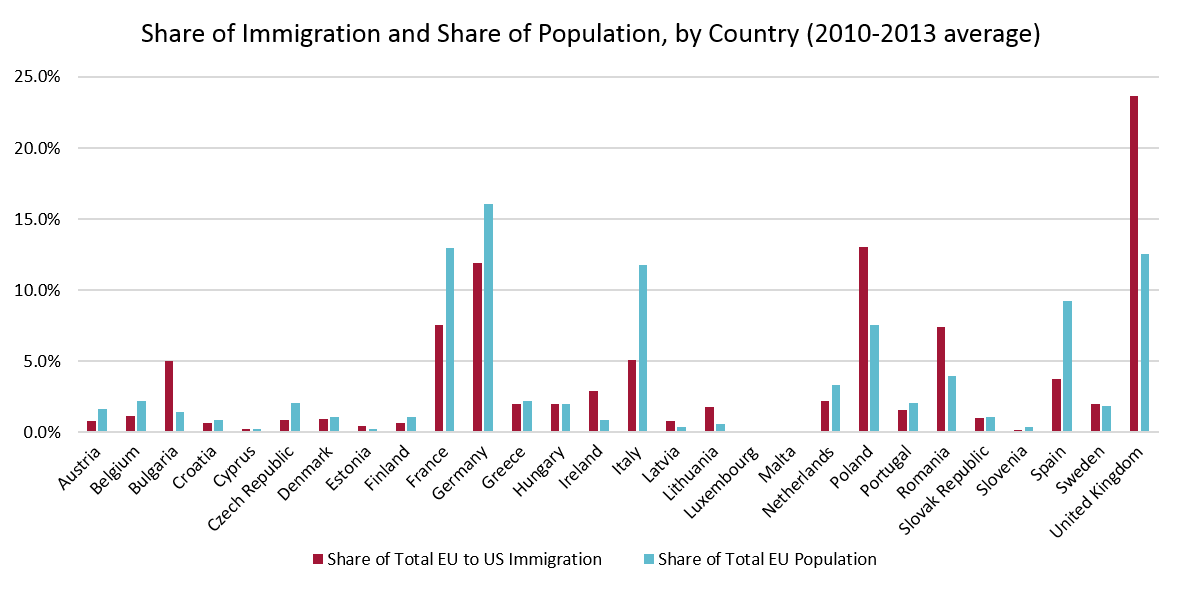
Source: Bruegel calculations based on the Yearbook of Immigration Statistics, US Department of Homeland Security
Employment-based immigration from the EU to the US
A US green card can be obtained through various means. Most immigrants receive green cards through family members who are US citizens or permanent lawful residents (about 65%). A smaller portion (16% of all green cards issued by the US in 2013) of immigrants receive green cards through their US employers, and this process is known as employment-based immigration. Although small in number, this category of immigrants typically includes exceptionally skilled individuals.
It is important to consider that US employment-based immigration requires US employers to petition on the immigrant employee’s behalf (pay the necessary fees, file the extensive paperwork, and deal with the US immigration system and Department of Labour). This entails that the immigrant employee must be a valuable asset to the employer.
The US reserves about 140 000 green cards each year for employment-based immigration. Preference is given to highly skilled immigrants. Green cards are also reserved, albeit in smaller numbers, for immigrants who establish companies large enough (and with enough funds). These immigrants are able to petition for themselves.
FIGURE 5
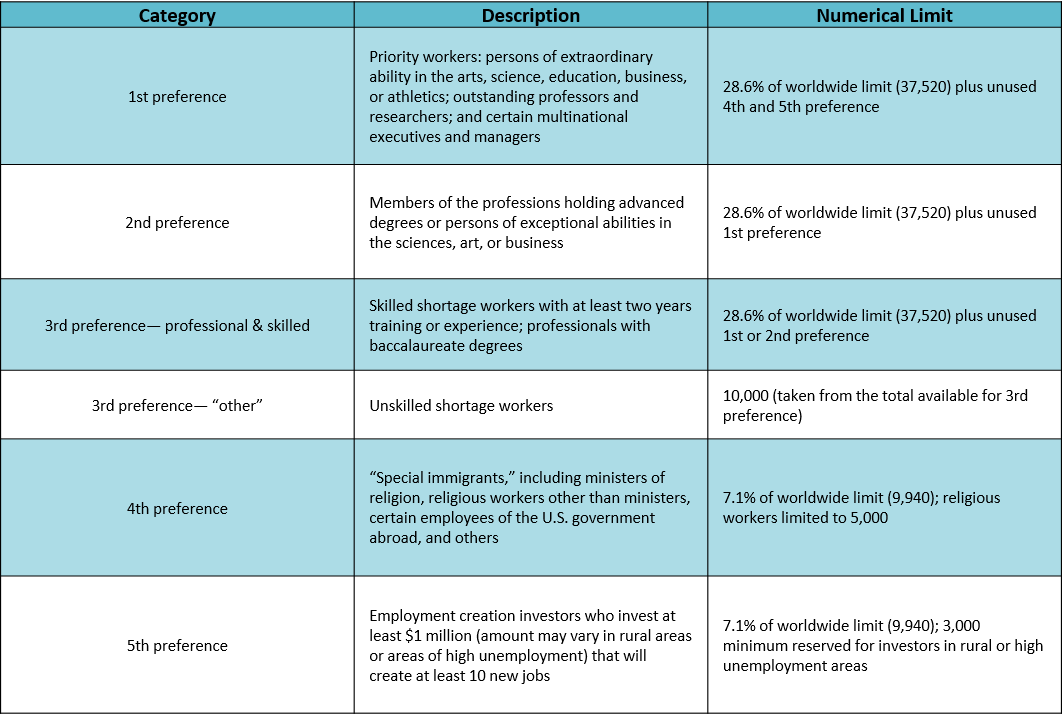
Source: CRS Summary of §§203(a), 203(b), and 204 of INA; 8 U.S.C. §1153
The EU is much better represented in employment-based immigration to the US than in total immigration. This means that the immigrants coming into the US from Europe are more skilled than immigrants coming into the US from other world regions. In 2013, 18 171 EU immigrants obtained green cards through employment. One in every three EU nationals obtaining green cards obtained them through employment, and 11% all employment-based green cards issued by the US were given to EU nationals. The EU’s share in US employment-based immigration is twice as high as its share in total US immigration.
Figure 5 shows the shares in employment-based immigration for the four regions in the EU and how the shares have changed over time.
FIGURE 6
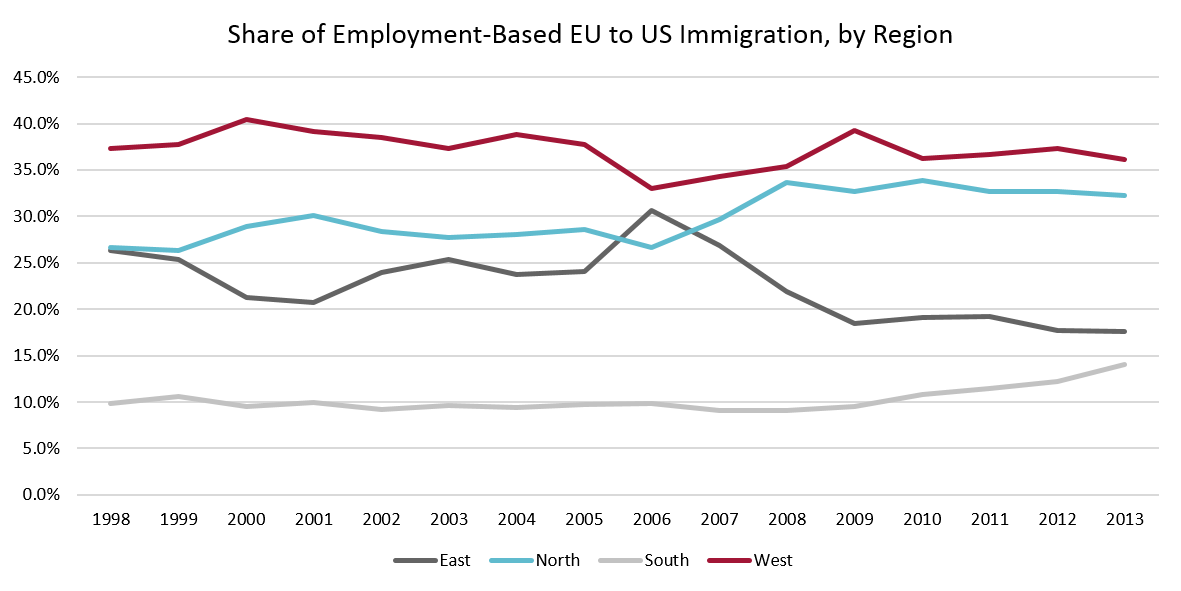
Source: Bruegel calculations based on the Yearbook of Immigration Statistics, US Department of Homeland Security
Comparing figures 3 and 5 shows that Eastern Europe is underrepresented in employment-based immigration considering its share in total immigration. Southern European countries, on the other hand, have similar shares in employment-related and total immigration. Northern countries have a larger share in employment-related immigration than in total immigration (which reflects the higher skill level of immigrants from Northern Europe). Western Europe, however, has the highest ratio of share in employment-based immigration to total immigration thanks to the UK (Ireland’s share in employment-based immigration is comparable to its share in total immigration).
The United Kingdom is by far the most important source for employment-based immigration from the EU to the US. Almost 6 000 UK nationals obtained green cards through employment in 2013, which was about one-third of all employment-related green cards issued to EU nationals that year and 45% of all green cards issued to UK nationals.
In comparison, about 2 100 employment-based green cards went to Frenchnationals in 2013, which represented about 11% of all EU employment-related green cards and 47% of all green cards issued to French nationals that year. ForGermany, this number was about 1 900 (only one-third of all green cards received by Germans). Italy and Spain each sent about 1 000 employment-related immigrants that year, which was about 35% and 39%, respectively, of the total number of immigrants they sent to the US.
In Eastern Europe, Poland and Romania contributed the largest numbers of employment-related immigrants (1 100 and 900, respectively, in 2013). These numbers were 17% and 23% of total green cards issued to their citizens. Note that the immigration coming from these countries was less employment-heavy in comparison to other EU countries.
In summary, the emigration of EU citizens to the US is not characterized by overcrowded flights and waiting times. It is, rather, a small and steady flow. Nevertheless, this small flow possesses exceptional skill and education levels. Behind the deceivingly low numbers is a huge potential for wealth creation that is permanently migrating to the US. The effects of this migration can be significant for many countries, especially the UK and France. Therefore, it is important that we know more about why these exceptionally talented Europeans move to the US, what contributions they make to the US economy, and, above all, what contributions the EU could have enjoyed if they had stayed.
This article was originally published by Bruegel, the Brussels-based think tank. Read the article on their website here.. Publication does not imply endorsement of views by the World Economic Forum.
To keep up with the Agenda subscribe to our weekly newsletter.
Author: Grace Choi joined Bruegel for the summer of 2015 as a research intern.Prof Dr. Reinhilde Veugelers is a full professor at KULeuven (BE) at the Department of Management, Strategy and Innovation. She is a Senior Fellow at Bruegel since 2009.
Image: A U.S. flag flies over the skyline of lower Manhattan in New York July 11, 2014. REUTERS/Lucas Jackson
Don't miss any update on this topic
Create a free account and access your personalized content collection with our latest publications and analyses.
License and Republishing
World Economic Forum articles may be republished in accordance with the Creative Commons Attribution-NonCommercial-NoDerivatives 4.0 International Public License, and in accordance with our Terms of Use.
The views expressed in this article are those of the author alone and not the World Economic Forum.
The Agenda Weekly
A weekly update of the most important issues driving the global agenda
You can unsubscribe at any time using the link in our emails. For more details, review our privacy policy.