5 trends in disbursements to Sub-Saharan Africa


Get involved with our crowdsourced digital platform to deliver impact at scale
Stay up to date:
Economic Progress
The 2015 International Debt Statistics database contains many different indicators to help understand external debt in low-and middle-income countries. This post looks at one: disbursements, in the context of countries in Sub-Saharan Africa.
So what are disbursements? Disbursements are simply the amount of a loan commitment (the total amount of new loans to borrowers for which contracts were signed) that is actually spent, in a given year. The reason I’ve decided to focus on disbursements is that this indicator offers a clear picture of developments in a given year while an indicator like external debt stock (which tell us how much a country owes its creditors – the entities that lend a country money) is a more cumulative measure as it is influenced by what happened in previous years.
In the analysis that follows, I’ve used 45 countries in Sub-Saharan Africa, excluding South Africa. Why? Simply because the size of South Africa’s external debt would mask the trends in the rest of the region. For some perspective, consider that the biggest economy in Africa (in terms of 2013 GDP), Nigeria, had an external debt stock of 14 billion USD in 2013 while South Africa (the second biggest African economy in terms of 2013 GDP) had one of 140 billion USD in the same year – ten times more.
Despite this exclusion, I think it’s important to note how huge this unit of analysis is. The 45 countries that I’ve used represent almost the whole African continent, with the exception of a handful of countries in the north of the continent. Therefore, I ask you to take these trends with a grain of salt, as they are aggregate trends and therefore some of the national differences are blurred out.
Disbursements to the region have doubled
First, the big picture: disbursements to Sub-Saharan Africa have increased sharply in the last few years. Between 2010 and 2013 they more than doubled (increased by 121%), while in the rest of the developing world disbursements went up by 42% (see figure 1). The increase in the region is particularly strong in the case of disbursements from private creditors (entities like bond holders and commercial banks), which increased almost sixfold (489%) since 2010 (compared to a rise of 52% in the rest of the developing world). In the same period, disbursements from official creditors (governments or other bilateral/multilateral entities) grew by 35% in the region (while they fell 13% in the rest of the developing world).
In 2013 private creditors overtook official creditors
In 2010, disbursements from official creditors totaled 14.9 billion USD while those from private creditors totaled 3.5 billion USD, but by 2013 disbursements from official creditors totaled 20.1 billion USD while those from private creditors totaled 20.6 billion USD. Private creditors have become bigger creditors than official creditors.
Bond disbursements increasing steadily since 2010
This is because, in some cases, a large component of this rise in disbursements from private creditors has been bonds (debt instruments which are similar to loans but differ in three main ways: they are usually purchased by many investors, they are disbursed fully once they are issued and the principal is repaid entirely when the bond matures), which have gone up to 34% of total disbursements from private creditors in 2013 (see figure 2).
As you can see in the chart below, bond disbursements have been increasing steadily since 2010 after falling around the 2008 financial crisis.
There have also been changes among disbursements from official creditors. Before 2010, multilateral creditors (international financial institutions like the World Bank Group) were the largest official creditors. They have now been overtaken by bilateral creditors (official agencies that make loans on behalf of governments) as you can see in figure 3, largely because China has become such a big lender in the region.
The public sector still has the largest share of disbursements
In terms of the debtor (borrower) composition of the debt, however, the changes are smaller. The public sector is still the biggest debtor (in terms of share of disbursements), but private debtors are catching up. While the private sector only received 3% of all disbursements from external creditors in 2007, by 2013 this figure increased to 17%.
Future prospects for the region
Given the rapid rise in disbursements to the region, should we be worried about rising debt burdens? The debt stock to GNI (gross national income) ratio suggests we should not be worried. This ratio has actually fallen somewhat, going from 26% in 2007 to 20% in 2013, indicating that economic growth has kept pace with the increase in debt. However, more recently the stronger United States Dollar has made repayment of United States Dollar denominated external debt more expensive. Furthermore, lower oil prices and sluggish export markets make it difficult for the export-oriented economies in the region.
This article originally appeared on The World Bank’s Open Data Blog. Publication does not imply endorsement of views by the World Economic Forum.
To keep up with Forum:Agenda subscribe to our weekly newsletter.
Author: Peter Bourke works at the Development Data Group’s Financial Data Team.
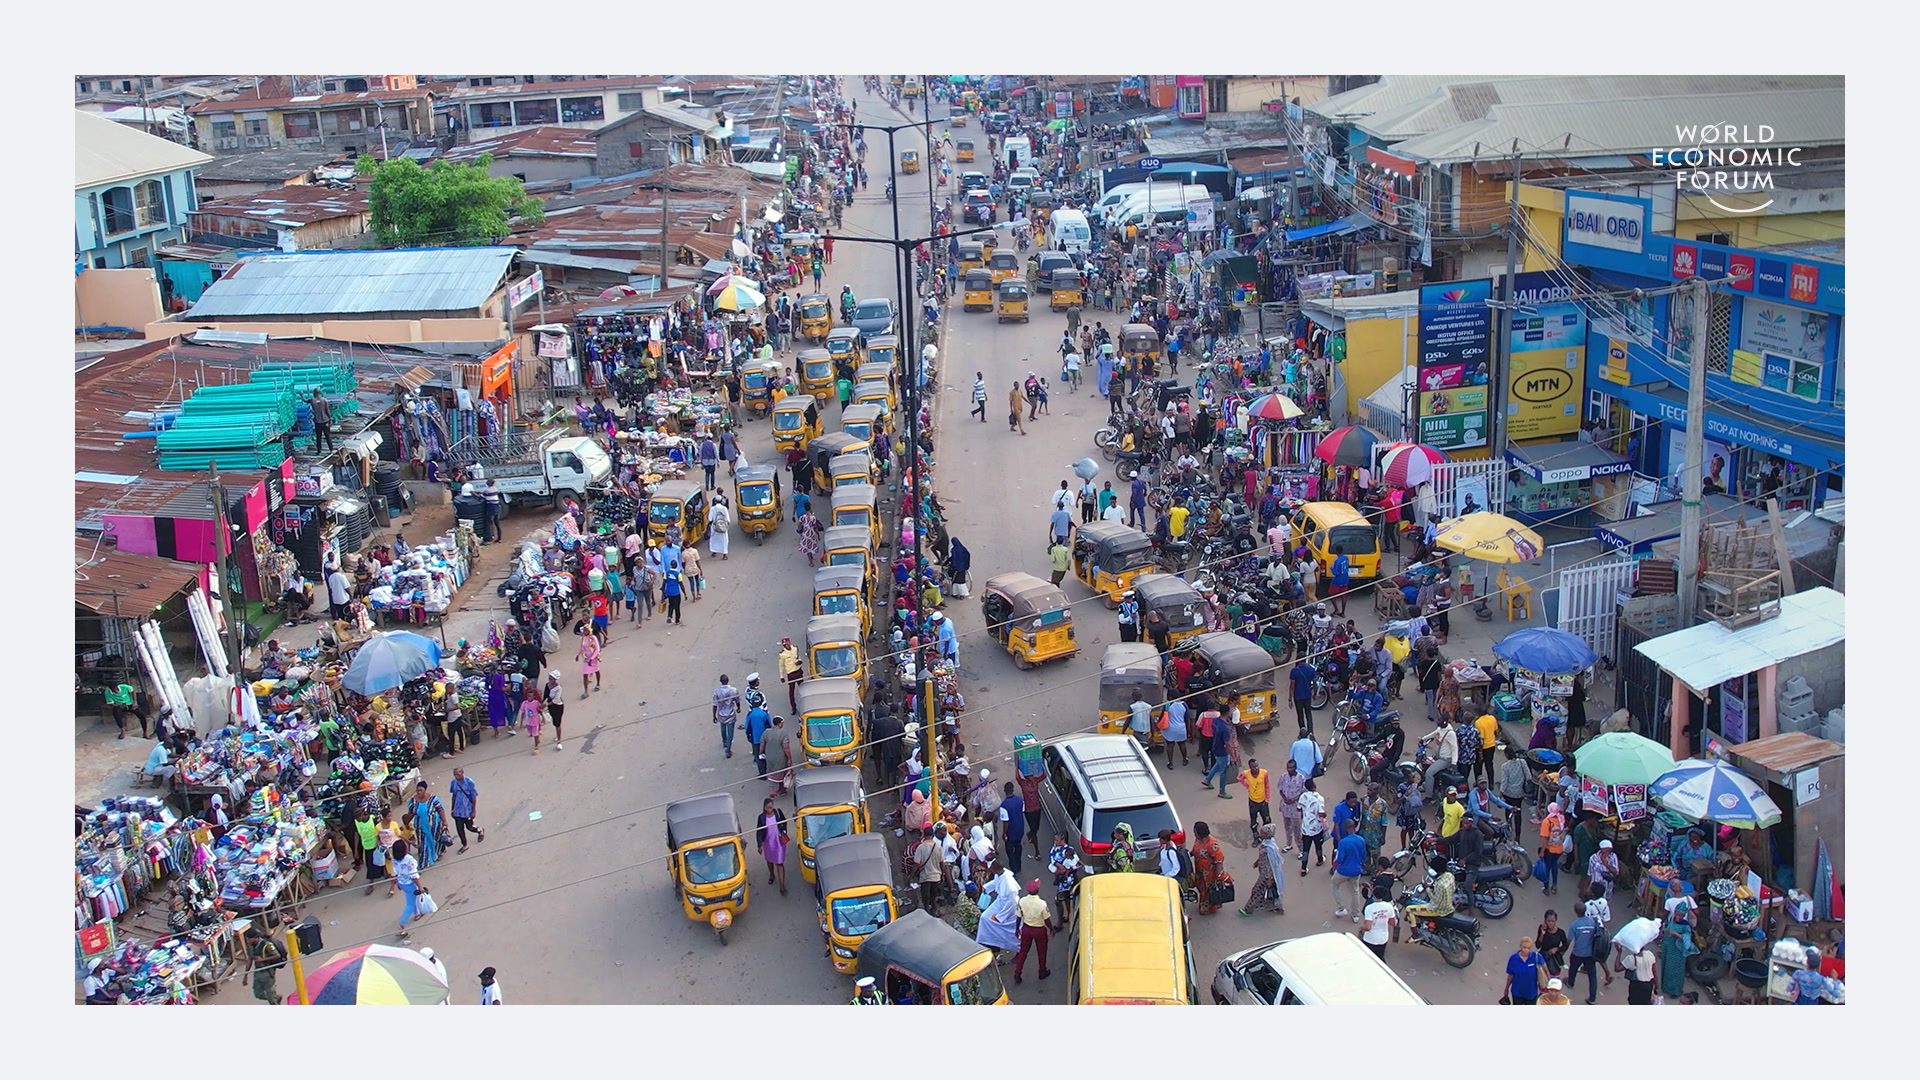
Image: A view is seen of the Nigeria stock exchange building in the central business district in Lagos. REUTERS/Akintunde Akinleye.
Don't miss any update on this topic
Create a free account and access your personalized content collection with our latest publications and analyses.
License and Republishing
World Economic Forum articles may be republished in accordance with the Creative Commons Attribution-NonCommercial-NoDerivatives 4.0 International Public License, and in accordance with our Terms of Use.
The views expressed in this article are those of the author alone and not the World Economic Forum.
The Agenda Weekly
A weekly update of the most important issues driving the global agenda
You can unsubscribe at any time using the link in our emails. For more details, review our privacy policy.
More on Economic GrowthSee all

Joe Myers
April 26, 2024

Simon Freakley
April 26, 2024

Emma Charlton
April 24, 2024

Piyachart "Arm" Isarabhakdee
April 23, 2024

Pooja Chhabria and Kate Whiting
April 23, 2024