Which of the world's four income groups are you in?

Image: REUTERS/Daniel Munoz


Get involved with our crowdsourced digital platform to deliver impact at scale
Stay up to date:
Economic Progress
Have you ever wondered how average incomes differ around the world?
To answer this question, Global Finance Magazine used World Bank data and compared countries by GNI per capita – the final income (in dollars) earned by residents, divided by the total population.
Each year, the World Bank classifies countries into four income groups, based on this calculation.
Low income: $1,045 or less
Lower middle income: $1,046 to $4,125
Upper middle income: $4,126 to $12,745
High income: $12,746 or more
How Much, a cost information website, mapped this data to show the situation around the world. In the following maps, high-income countries are shown in green, upper middle in yellow, lower middle in orange and low income in dark orange.
North America

North and Central American nations sit mainly in the top two income categories, reflecting the relatively high incomes seen in this part of the world.
Europe

As with North America, most of Europe sits in the top two income groups. There is, however, a very clear divide between Western Europe and those countries further east.
Asia, Russia and the Middle East

Asia and the Middle East present a much more mixed picture, with countries from all income groups represented in the map. The use of GNI per capita also highlights other interesting patterns. For example, while China might be one of the largest economies in the world, with a GDP of over $10 trillion in 2014, its huge population means it ends up only in the second highest group when measured by GNI.
Oceania

The regional powerhouses of Australia and New Zealand both sit in the top group. However, the rest of the region sees much lower average incomes.
Africa
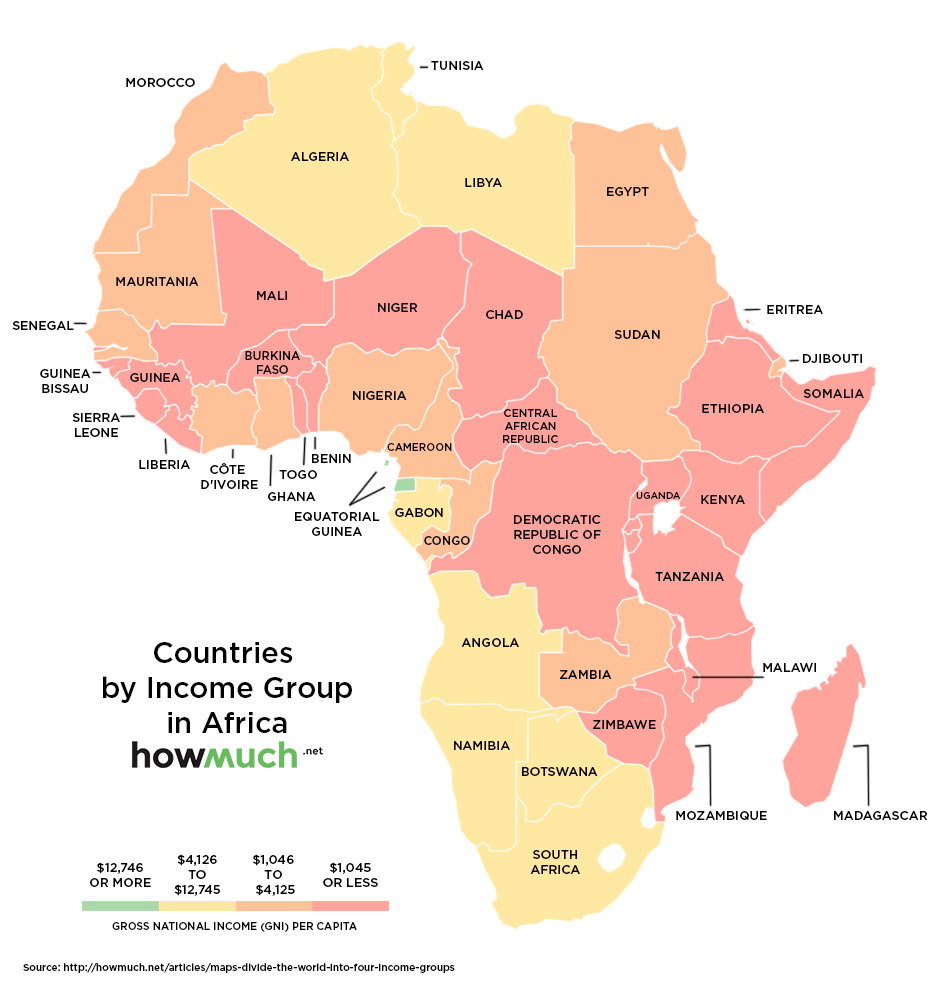
Africa is dominated by economies in the low and middle-income groups, with just Equatorial Guinea making the high-income group. The work still needed to raise incomes in Africa, relative to the rest of the world, is obvious from this map.
South America

Most South and Central American countries sit in the upper-middle income group. However, both high-income and lower-middle income countries are also present on the continent.
Don't miss any update on this topic
Create a free account and access your personalized content collection with our latest publications and analyses.
License and Republishing
World Economic Forum articles may be republished in accordance with the Creative Commons Attribution-NonCommercial-NoDerivatives 4.0 International Public License, and in accordance with our Terms of Use.
The views expressed in this article are those of the author alone and not the World Economic Forum.
The Agenda Weekly
A weekly update of the most important issues driving the global agenda
You can unsubscribe at any time using the link in our emails. For more details, review our privacy policy.
More on Economic GrowthSee all

Joe Myers
April 26, 2024

Simon Freakley
April 26, 2024

Emma Charlton
April 24, 2024

Piyachart "Arm" Isarabhakdee
April 23, 2024

Pooja Chhabria and Kate Whiting
April 23, 2024