Can big data really help end poverty?
The limited availability of data on poverty and inequality poses major challenges to the monitoring of the World Bank Group’s twin goals – ending extreme poverty and boosting shared prosperity. According to a recently completed study, for nearly one hundred countries at most two poverty estimates are available over the past decade.Worse still, for around half of them there was either one or no poverty estimate available.* Increasing the frequency of data on poverty is critical to effectively monitoring the Bank’s twin goals.
Against this background, the science of “Big Data” is often looked to as providing a potential solution. A famous example of this science is “Google Flu Trends (GFT)”, which uses search outcomes of Google to predict flu outbreaks. This technology has proven extremely quick to produce predictions and is also very cost-effective. The rapidly increasing volumes of raw data and the accompanying improvement of computer science have enabled us to fill other kinds of data gaps in ways that we could not even have dreamt of in the past.
However, recent articles have raised some concerns. One of these is that “Big Data” can fall into a so called “Drunkard’s search” or “Streetlight effect”. This can be roughly illustrated, as follows:
A drunkard is looking for his lost key under a streetlight. A policeman asks “What did you lose”. The man answers “a key, but I can’t find it.” The policeman asks him “Do you remember where you lost the key?” He replies “Yes, over there”. The policeman, who appears confused, asks “Then, why don’t you look for it over there?”. The drunkard answers “because there is no light!”
Statisticians use this “Drunkard’s search” to explain a type of observational bias where people search for answers in places where looking is easiest. “Big Data” science demonstrates how tremendous advances can be made via easy access to massive data and the high powered software and computational power needed to analyze the data. But, is there any guarantee that “Big Data” will generate insights on those questions we are most interested in? Or does “Big Data” simply pertain to information than can be easily collected and assembled? Notwithstandingthe recent improvements in internet access in developing countries, many of the poor remain without access to the internet and the necessary computer literacy. The “Drunkard’s search” refers to a real concern for the use of “Big Data” for poverty estimation and analysis.
Tim Harford raises an interesting example of this kind in the Financial Times. To predict whether Franklin Delano Roosevelt would win the presidential election, The Literary Digest, a magazine, conducted a massive postal opinion poll, with the ambition of reaching 10 million people, a quarter of the electorate. After processing around 2.4 million returns, the Literary Digest predicted the republican candidate, Alfred Landon, would win, while a far smaller survey conducted by the opinion poll pioneer George Gallup predicted Franklin Roosevelt would win. We all know who won this contest.
Why did Gallup win? Gallup’s sample was carefully designed to reflect the distribution of republican, democrat, and independent voters. The Literary Digest, on the other hand, mailed out forms to people on a list compiled from automobile registrations and telephone directories: a sample that was disproportionatly representative of the rich Worse, Landon supporters turned out to be more likely to respond to the survey. The combination of these two sampling peculiarities resulted in a large bias in predicting the winner of the election.
The moral of this story is that without proper sampling, any statistic derived from a survey could be biased. Increasing the sample size may reduce sampling error but will not eliminate the bias. A large but biased sample will produce “precisely wrong statistics,” : statistics with an extremely small sampling error, but still reflecting biases.
Whether “Big Data” methods work or not comes down to whether the data reflect the distribution of populations of interest or not. Analysis using a database of customers, which is often massive, will be extremely useful for a retailer because they are mostly likely the retailer’s population of interest, i.e., future customers. But, “Big Data” collected through internet or compiled in data clouds might not be particularly useful for poverty estimation and analysis because the data providers might not include the poor in whom we are most interested. Even if the data include the poor, the relative frequency of observations describing the rich will likely be higher than for the poor, and thus simple averages of this kind of data will be biased towards the rich.
To address issues of “Big Data”, some are now proposing blending the convenience of “Big Data” approaches with the statistical rigor of “Small Data” approaches. Lazer, et. al. (2014) call this an “All Data Revolution”. The article shows how the Centers for Disease Control and Prevention (CDC) successfully reduced the error of GFT by using information collected by a traditional “Small Data” approach. The US Census and Labor Department are also proposing several ideas of how best to achieve a “blend of Big Data with Small Data”.
The World Bank Group is also now proposing various initiatives that blend “Big Data” with “Small Data” for poverty estimation. SWIFT (Survey of Well-being via Instant and Frequent Tracking) is one such initiative. Like typical “Small Data” efforts, SWIFT collects data from samples that are representative of underlying populations of interest. Like typical “Big Data” approaches, SWIFT applies a series of formulas/algorithms, as well as the latest ITS technology, to cut the time and cost of data collection and poverty estimation. For example, SWIFT does not estimate poverty from consumption or income data, which is time-consuming to collect, but uses formulas to estimate poverty from poverty correlates, which can be easily collected. Furthermore, by embedding the formulas into the SWIFT data management system, the correlates will be converted to poverty statistics instantly. To further cut the time for data collection and processing, SWIFT uses Computer Assisted Personal Interview (CAPI) linked to data clouds, and if possible, adopts a cell phone data collection approach.
“Big Data” science is still at its early stages and innovations in this field are rolling out at the speed of light. Such innovations might yield entirely new solutions in the near future. But I strongly believe that it is very important to recognize the risks that could attend use of “Big Data” methods. Before conducting any analysis using ”Big Data”, we must carefully check whether the underlying data accurately capture the populations of interest; otherwise, we might simply be trapped in a “Drunkard’s search”.
*Hiroki Uematsu, Serajuddin, Umar, Christina Wieser, and Nobuo Yoshida. (2014) “Monitoring Poverty and Shared Prosperity: Data in Developing Countries,” mimeo, World Bank.
This article was first published by the World Bank’s Let’s talk development blog. Publication does not imply endorsement of views by the World Economic Forum.
To keep up with Forum:Agenda subscribe to our weekly newsletter.
Author: Nobuo Yoshida is a senior economist in Poverty Reduction and Equity Group (PRMPR) at the World Bank.
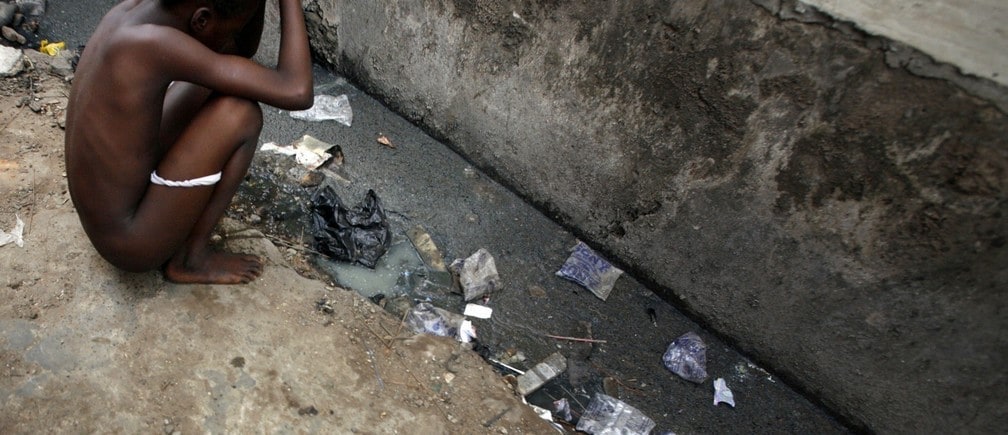
Image: A Nigerian child squats by an open sewer in the neighbourhood of Isale-Eko in central Lagos, April 14, 2007. REUTERS.
Don't miss any update on this topic
Create a free account and access your personalized content collection with our latest publications and analyses.
License and Republishing
World Economic Forum articles may be republished in accordance with the Creative Commons Attribution-NonCommercial-NoDerivatives 4.0 International Public License, and in accordance with our Terms of Use.
The views expressed in this article are those of the author alone and not the World Economic Forum.
Stay up to date:
Hyperconnectivity
Forum Stories newsletter
Bringing you weekly curated insights and analysis on the global issues that matter.