This chart shows how global debt comes in waves – and, right now, we’re in the middle of the biggest one yet

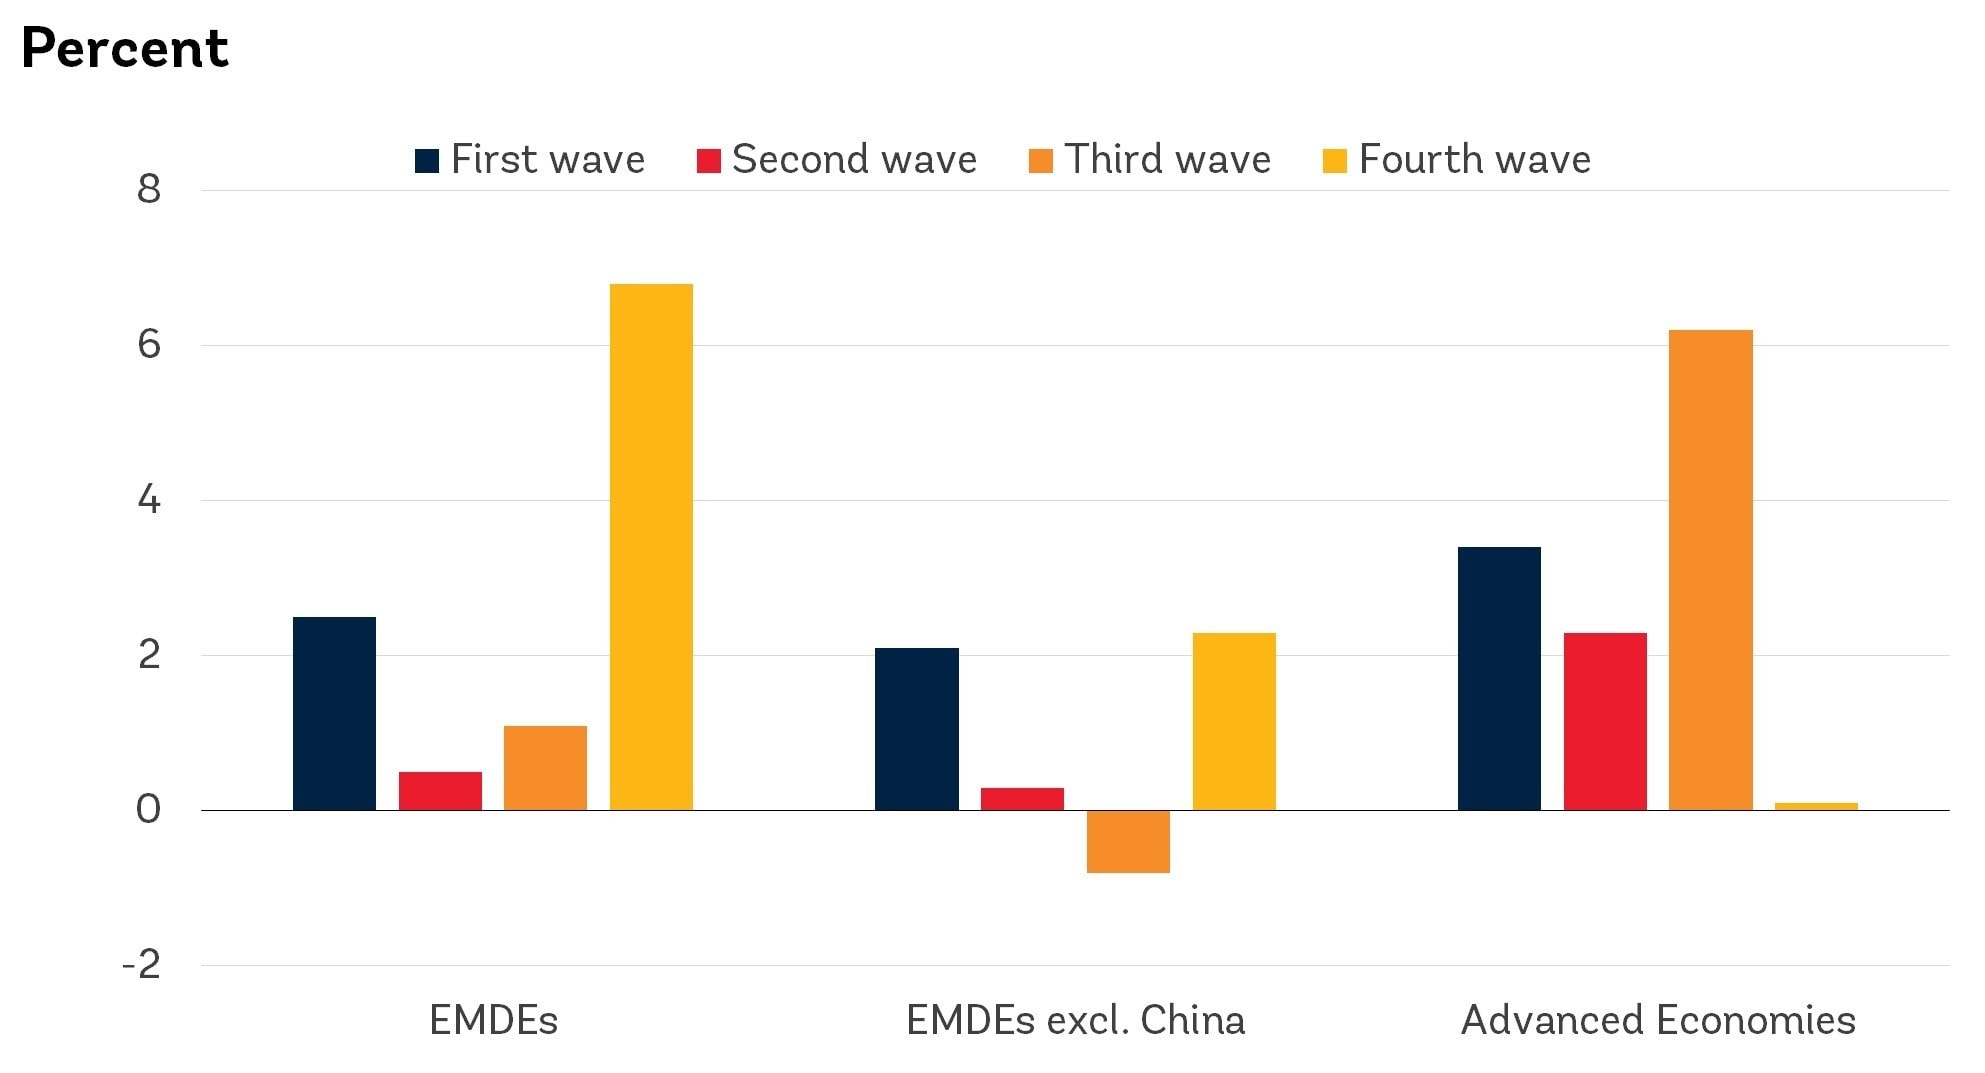
There have been four waves of debt accumulation in the global economy since 1970. Image: Unsplash/rupixen.com
- Since 1970, three debt waves have ended in financial crises for emerging and developing economies, according to the World Bank.
- The fourth and current debt wave started in 2010 and was of serious concern even before COVID-19.
- Global public debt will be at around 100% of GDP until 2025, says the International Monetary Fund.
- Economic output is expected to recover as vaccines are rolled out, but the outlook for borrowing is harder to predict.
The world is currently experiencing unprecedented levels of debt, as governments continue to battle the coronavirus. But this is not the first time global debt has spiked.
There have been four waves of debt accumulation in the global economy since 1970, according to the World Bank.
These have occurred across more than 100 countries and have, so far, always culminated in financial crises in many emerging and developing economies.
The fourth debt wave, which is still ongoing, started in 2010 and – even before the COVID crisis – looked like being the worst yet.
“The size, speed and breadth of the latest debt wave should concern us all,” World Bank Group President David Malpass said at the launch of the World Bank’s study Global Waves of Debt: Causes and Consequences in December 2019, weeks before the start of what became the COVID-19 pandemic.
Ballooning debt
Since then, government borrowing has soared as countries battle to keep their economies afloat during global lockdowns.
In November 2020, the Institute of International Finance predicted that global debt would surge to $277 trillion by the end of that year, representing a debt-to-GDP ratio of 365%.
Around $12 trillion has been spent so far on unprecedented fiscal actions, including temporary tax cuts, loans and capital injections, the International Monetary Fund (IMF) found in its latest Fiscal Monitor.
Combined with economic stimulus measures already in the pipeline, this is forecast to push public debt globally to a record level of about 100% of GDP until 2025.

Listen here.
Lessons from the past
History shows it is not unusual that countries can keep borrowing even when default risk is high.
“A review of 89 default episodes from 1827 to 2003 shows the typical experience to be a sharp rise in borrowing, both external and domestic, in the run-up to default,” say the authors of a 2020 blog for the IMF, entitled The Debt Pandemic. “Ideally this time will be different, but the record is not encouraging.”
Historical data is vital in predicting future potential trends and government indebtedness is a key guide to economic health.
The IMF’s DataMapper tool includes data on central government debt going back to the 1950s and has an interactive timeline showing how the world’s debt map has changed over the decades.
In 1950, for example, government debt in the United States as a percentage of GDP was 78.2% – a year when the Korean War boosted growth and debt in the country, according to US personal finance site The Balance.
In the battle against COVID-19, forecasters expect economic output will recover as vaccines are rolled out, but say the outlook for borrowing is harder to predict.
“These growing debts have been manageable thanks to an extended period of low interest rates and loose monetary policy,” says financial writer Marcus Lu in a blog for the World Economic Forum. “But whether or not this is sustainable remains to be seen.”

Don't miss any update on this topic
Create a free account and access your personalized content collection with our latest publications and analyses.
License and Republishing
World Economic Forum articles may be republished in accordance with the Creative Commons Attribution-NonCommercial-NoDerivatives 4.0 International Public License, and in accordance with our Terms of Use.
The views expressed in this article are those of the author alone and not the World Economic Forum.
Stay up to date:
Social Protection

Forum Stories newsletter
Bringing you weekly curated insights and analysis on the global issues that matter.
More on Financial and Monetary SystemsSee all

Ibrahim Alramady
July 1, 2026


