Which countries emit the most greenhouse gas?

Negotiators are meeting in the lead up to the United Nations’ 21st Conference of the Parties in December this year.
In Paris, the hope is that the world’s governments will come to an agreement on how much and how quickly countries will limit their emissions of carbon dioxide and other greenhouse gases, in order to ensure that the world’s climate does not warm by more than 2 degrees on average.
So, which countries will come under the most pressure to transform their economies, on account of their high carbon-dioxide emissions? It is a fraught question, made more so by complicated measurement and methodology.
Firstly, there is the question of whether you include or exclude change of land use. A country can radically affect its emissions levels by changing what it is doing with its land – clearing forests for crops, shifting from crop growing to cattle grazing, for instance – hundreds of different regulated and unregulated land usages that are monitored and included in calculations of greenhouse gas emissions (GHG). The tables below show calculations that both include and exclude land-use changes.
Secondly, which measure matters? Is it the absolute amount of carbon dioxide emitted by a country in a particular year? In which case, it would be the world’s largest economies: China, the United States and Europe.
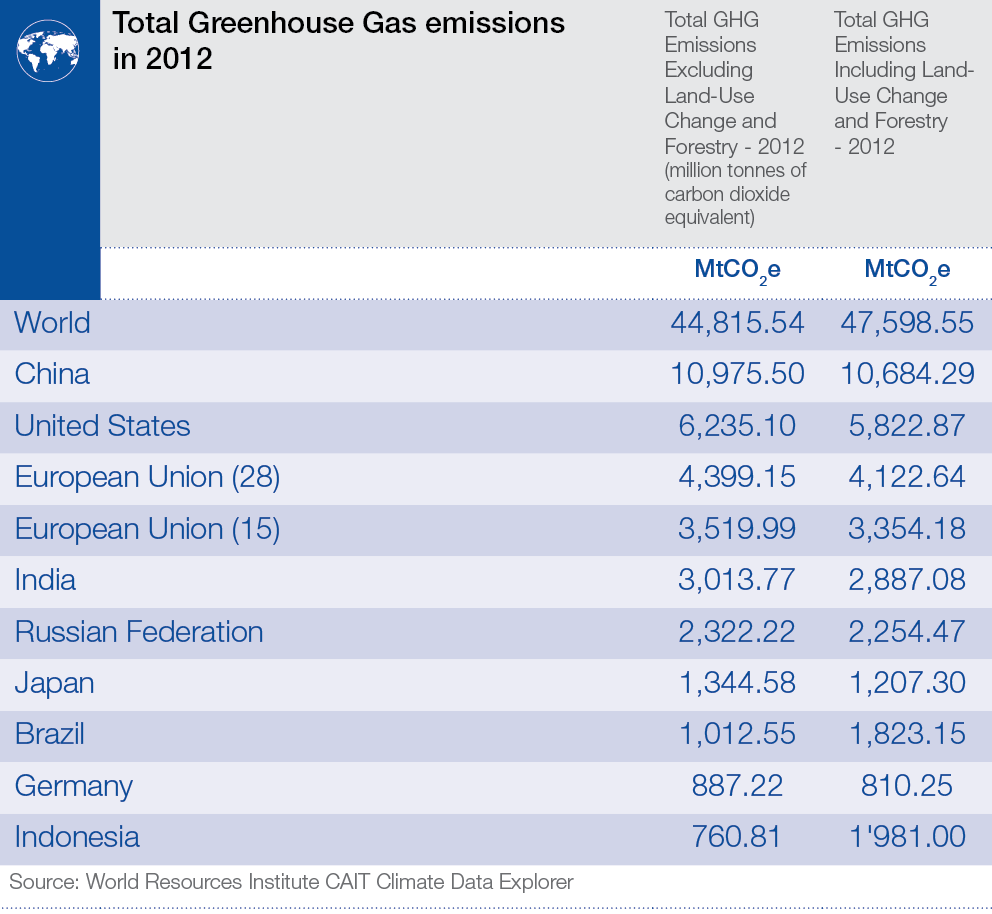
That is not entirely fair, though: China argues that for each person, the country emits far fewer greenhouse gases. If we take a per capita measure, then those countries that produce fossil fuels, and export them, come top of the table.

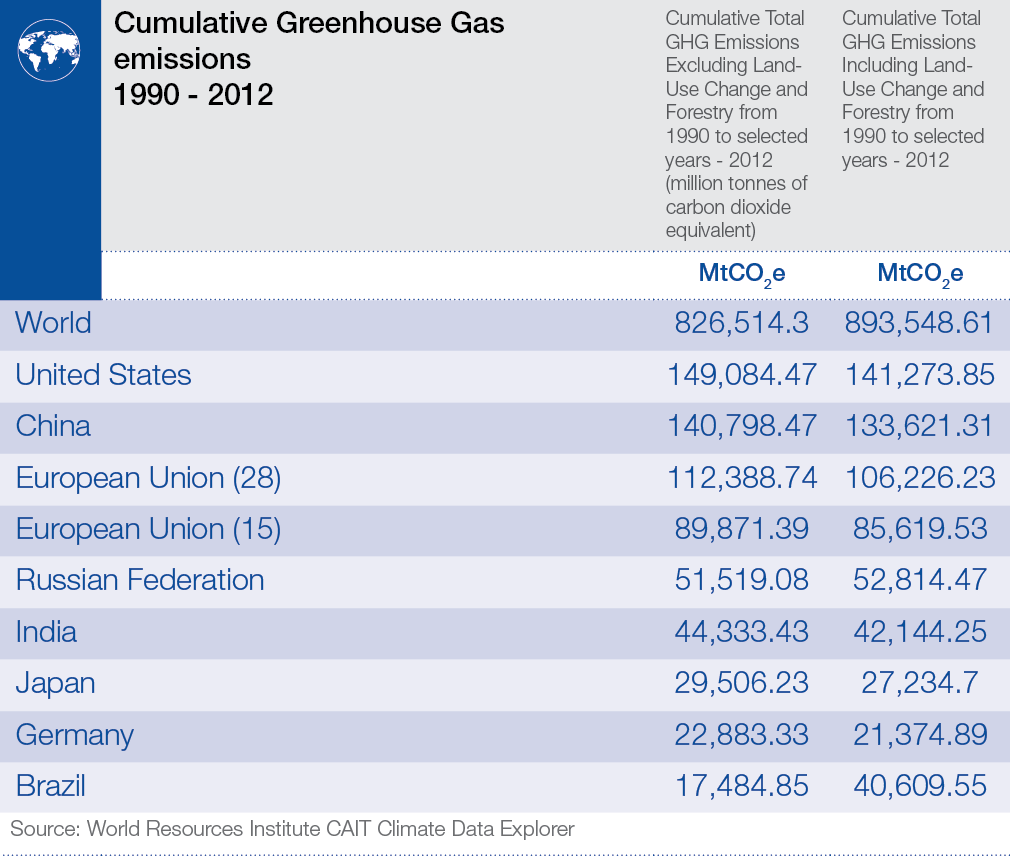
Taking just one year of emissions data is also misleading. What about a country’s history of carbon emissions? The following table shows cumulative absolute emissions since 1990.
And developing countries would argue that these figures don’t go back nearly far enough. What about the 150 years before 1990, during which the rich countries underwent all their industrialization, and contributed most to the stock of carbon dioxide in the world’s atmosphere?
The negotiators face a complicated job, given the proliferation of measures and factors. If what is measured matters, the basis of measurement is a crucial starting point.
Author: Mike Hanley, Head of Digital Communication, World Economic Forum.
Image: A demonstrator holds up a sign during a march past the White House to protest against the Keystone XL pipeline in Washington. REUTERS/Richard Clement
Don't miss any update on this topic
Create a free account and access your personalized content collection with our latest publications and analyses.
License and Republishing
World Economic Forum articles may be republished in accordance with the Creative Commons Attribution-NonCommercial-NoDerivatives 4.0 International Public License, and in accordance with our Terms of Use.
The views expressed in this article are those of the author alone and not the World Economic Forum.
Stay up to date:
Future of the Environment
Related topics:

Forum Stories newsletter
Bringing you weekly curated insights and analysis on the global issues that matter.
More on Global CooperationSee all

Farwa Aamer and Nadia Mondini
June 24, 2026


