Is Europe outperforming the US?

Kalin Anev Janse
Chief Financial Officer and Member of the Management Board, European Stability Mechanism (ESM)The United States often prides itself on being the world leader on bringing the most economic benefits to its population. But is it true? When it comes to measures of wellbeing – and even on many straight economic growth measures — the European Union leads the way, according to this opinion piece by Kalin Anev Janse, who is secretary general and also a member of the management board of the European Stability Mechanism (ESM). The ESM, often called the eurozone’s lender of last resort, is responsible for providing financial assistance to eurozone countries or to banks that need a capital injection. The ESM replaced the temporary European Financial Stability Facility (EFSF) in 2012.
The United States and the European Union (EU) have engaged in a friendly economic rivalry for decades. Both have been quite successful, but which of the powerhouses holds the competitive edge? While the two have roughly the same GDP, around €18.9 trillion for the EU and €18.3 trillion for the U.S. at the end of 2015, the EU has a larger population, 507 million citizens versus 319 million, meaning this calculation comes out in the U.S.’s favor.
But simply looking at this headline figure does not give a sufficiently nuanced view of the comparative strengths of the two powerful areas. We need to dig deeper to see how — and more importantly, for whom — the two deploy the wealth they create.
Although counterintuitive on the surface, that exploration will reveal that the EU is better at harnessing that wealth creation for the betterment of its citizens. And that betterment is both intentional and at the core of Europe’s economic success.
Since 1994, GDP per capita growth has expanded in parallel in the U.S. and in those countries that use the euro as a currency, the euro area — Figure 1.

Between 1999, when the euro was launched, and 2008, average GDP growth per capita expanded by 1.6% in both geographies. At times the euro area outperformed, such as in the post-2001 technology crisis in the U.S. At others, the U.S. grew more briskly, such as its rebound from the 2008 crisis. Overall, however, they followed the same trend.
“Europe managed to make a much broader base of society wealthier. Was this easy? No, but it was the result of intentional policy decisions.”
But wealth is merely a tool. The question at hand is how that wealth is used. When one looks under the surface of this question, and examines how this wealth is transformed into wellbeing, then Europe’s economic success begins to take form and shape. A study conducted by the Boston Consulting Group on economic wellbeing around the world assesses how wealth is translated across three elements and 10 dimensions: economics (income, economic stability, employment); investments (health, education, infrastructure); and sustainability (income equality, civil society, governance and environment).
Figure 2: Wealth-to-wellbeing coefficient in selected countries in 2015

Source: BCG “Why Well-being Should Drive Growth Strategies” 2015
From 2006 to 2013 Germany and the U.S. both recorded an average GDP per capita growth rate of 1.1%. Germany’s ability to convert growth into economic wellbeing was equivalent to an economy growing at an average rate of 6.2%, while the U.S. managed a measly average rate of just 0.5%. Improvements in health services, affordable education and good public transportation have immediate benefits for citizens’ lives.
Figure 2 shows the transformative power of these gains, and offers another insight into how the euro area is actually outperforming the U.S.We could go yet another level deeper and unearth how wealth creation has benefitted different slices of the population. Take the bottom 90% of earners in a country.
If we look at growth in real average income for this group over the period 1950-2013, its real wage income grew some 70% in the U.S., dwarfed by gains of 150% in Italy and the United Kingdom and of a whopping 250% in France and Germany. This means that belonging to the “bottom 90%” in Europe is much better than in the U.S. — Figure 3.
Figure 3: Growth, real average income, for bottom 90%
Index, 1950=100 (log scale)

Source: World Economic Forum 2015
Now, if we turn to the top 1% of income earners, France, Germany, the United Kingdom, and the U.S. all had some 7%-9% of their population in this bracket in 1975. Over the last 40 years, this percentage doubled to 18% in the U.S., but it expanded more modestly in Europe. The United Kingdom’s share grew the most, to 13%, followed by Germany at 12%, while in France and Italy it also expanded but remained below 10% — Figure 4. Europe managed to make a much broader base of society wealthier. Was this easy? No, but it was the result of intentional policy decisions and it happened in a very challenging context: while navigating at high-speed the delicate and complex task of growing the union.
Figure 4: Percent of population in the 1% income bracket, 1975-2013
Source: World Economic Forum 2015
The EU gathered in 13 new countries in the last decade (10 in 2004, two in 2007, and one in 2013), all of which were much poorer than the older union members. With the exception of Malta and Cyprus, these countries had a GDP below 75% of the EU average when they joined, making it a particular challenge to embrace the 106.8 million new EU citizens, the equivalent of 27.6% of EU population. The countries quite rapidly gained access to the single market, which allows travel, capital and labor to flow freely. This freedom of movement, access to European subsidies, and investments in the new Member States allowed them to catch up rapidly. For the two 2007 joiners, for example, Bulgarian GDP per capita grew to $7,500 in 2013 from $4,400 in 2006, and in Romania to $9,500 from $5,800 over the same time period. This represents a compounded annual growth rate of 7.9% for Bulgaria and 7.3% for Romania notwithstanding the severest economic crisis of the last 80 years.
“Over recent decades the [EU] has also proven to be an enviably efficient wealth creation machine – and not just for those at the top of the population, but for the entire society.”
Why are these figures not better known? Europe is not good at “marketing” itself. Despite a tough sovereign debt crisis, the debt to GDP of the 28-country euro area is 89% or, for the earlier 19-country euro area 96%. The U.S. figure is 105%. The euro area’s fiscal balances are healthier — Figure 5; the euro 15-country area’s productivity per hour worked exceeds that of the U.S., and its labor markets are getting stronger: Since 2000, the employment rate has increased in the euro area but fallen by around six percentage points in the U.S. The participation rate in the euro area stabilized after rising in 2009; in the U.S. it continues to decline.
Figure 5: Selected comparative fiscal balances (% of GDP)
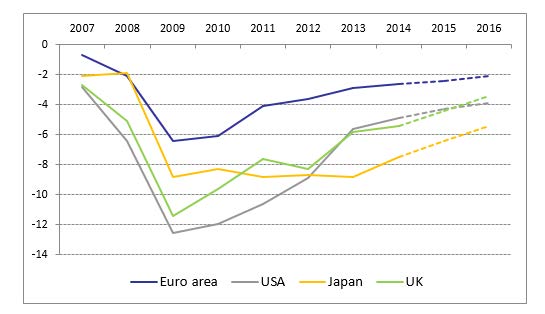
Source: European Commission, Economic Forecast — Spring 2015
Of course, the U.S. has several strengths compared to Europe: an exceptional entrepreneurial culture, a competitive edge in technology and innovation and better developed capital markets, as many U.S. companies rely on these markets to fund expansion rather than on banks. A single country with a common language also makes it easier to have an integrated economy.
Among Europe’s strengths, the EU remains one of the largest economies in the world with a GDP per head of US$37,000 for its over half billion citizens and consumers. It is the world’s largest trader of manufactured goods and services, whose large internal market accommodates 65% of its overall trade, given low labor costs and a well-educated common market workforce. It is also first in both inbound and outbound international investments. It is a top trading partner for 80 countries compared to 20 plus for the U.S. Excluding fuels, the EU imports more from developing countries and continents, such as Africa, than Canada, China, Japan and the U.S. — combined. The EU, at peace and united in diversity, benefits from low-cost development and greater social responsibility, particularly on issues of welfare and climate control.
With all this in mind, is Europe outperforming the United States? The EU has long been seen as the best peace creation project of all time, with no wars at its core over the last 70 years. Over recent decades it has also proven to be an enviably efficient wealth creation machine – and not just for those at the top of the population, but for the entire society, including 100 million new citizens over the past decade. This means that if you are lucky enough to belong to the top 1% or 10% in the U.S., you are no doubt quite well off. In Europe, life at the top is also not bad, but if you happen to be, like the majority of the population, in the bottom 90%, or one of 450 million people, in Europe you are far better off.
Not only is Europe producing an admirable and competitive growth model, it is, by design and conviction, deploying the wealth generated in economic solidarity with its broader population, not just for the top 1%. That is Europe’s greatest economic accomplishment, its greatest competitive advantage and the key to its outperformance.
Figures 6 and 7
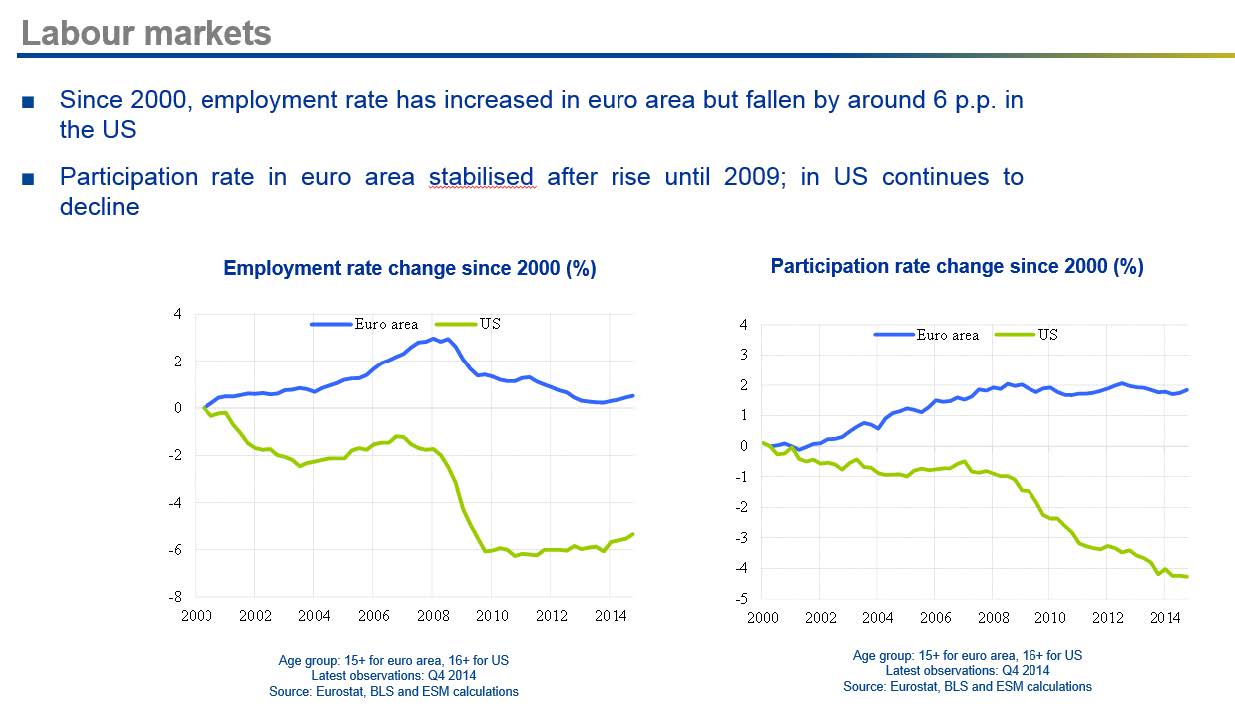
Age group: 15+ for euro area, 16+ for U.S. — Latest observations Q4 2014
Source: Eurostat, BLS and ESM calculations
Republished with permission from Knowledge@Wharton, the online research and business analysis journal of the Wharton School of the University of Pennsylvania.” Publication does not imply endorsement of views by the World Economic Forum.
To keep up with the Agenda subscribe to our weekly newsletter.
Author: Kalin Anev Janse is secretary general and also a member of the management board of the European Stability Mechanism (ESM).
Image: A European Union (E.U.) flag flutters. REUTERS/John Kolesidis.
Don't miss any update on this topic
Create a free account and access your personalized content collection with our latest publications and analyses.
License and Republishing
World Economic Forum articles may be republished in accordance with the Creative Commons Attribution-NonCommercial-NoDerivatives 4.0 International Public License, and in accordance with our Terms of Use.
The views expressed in this article are those of the author alone and not the World Economic Forum.
Stay up to date:
United States
Related topics:

Forum Stories newsletter
Bringing you weekly curated insights and analysis on the global issues that matter.
More on Economic GrowthSee all

Rishika Daryanani, Daniel Waring and Tarini Fernando
November 14, 2025


