Cap rates, cycles and how to inflate a real estate bubble

One of the key metrics in commercial real estate investment is the yield or cap rate (capitalization rate); at its simplest, the ratio of the rent paid by the tenant to the price paid for a building (or, sometimes, the appraised value of a building held for investment). The cap rate is one of the most important indicators of the current state of the market. Cap rates are inversely related to value; as cap rates compress, perceived value goes up; falling prices imply increasing cap rates. Decreases in yields (cap rates) may be an important early warning sign that a market is overheating – particularly if cap rates diverge from sensible fundamentals. Most of all, when market participants start claiming that low cap rates result from “a new paradigm” or a “significant change in the dynamics of the market”, it’s probably time to sell up and run for the hills. But given that yields are one of the few statistics that are routinely and regularly observed in markets, it seems odd that many participants seem to accept yield shifts as natural rather than as a source for concern.
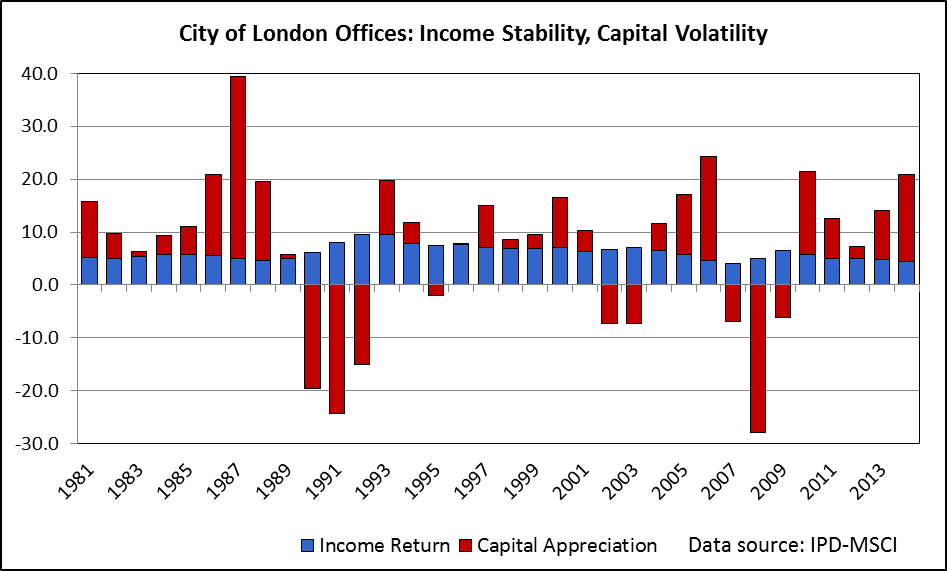
Separating out real estate returns into rental income and capital appreciation components, it is evident that the income return is remarkably stable over time in most markets. Capital growth – and more significantly capital declines – drive asset value volatility. As an illustration, IPD-MSCI data show that the annual net rental income return of City of London offices ranged from 4.1% and 9.5% between 1981 and 2014, with a standard deviation of just 1.3%. By contrast, capital appreciation ranged from -28% to +34% over the same period with a standard deviation of 13% (see the chart below). Capital value changes are, in large measure, dominated by changes in the cap rate. The rising prices and values before the financial crisis were driven not by rental growth but by cap rate (yield) compression; the same was true in the sharp market correction that followed. This echoes findings by Bob Shiller in equity markets, where earnings remain relatively stable over time; changes in the price-earnings ratio are driven by price changes.
We can interpret the cap rate as simply the outcome of supply and demand in the property investment market. If there is an excess of capital trying to get into a market relative to the investment opportunities available, prices will be forced upwards and cap rates will be forced down because demand exceeds supply.
Now, what financial theory tells us – and what we tell our students – is that the cap rate should be the required return on real estate less the long run growth in rental income (adjusted for depreciation). The required return reflects interest rates in the economy, the investors’ cost of capital and their attitudes to risk. In turn, the required return in the market should be the risk free return plus a risk premium appropriate to the riskiness of the type of asset:
k = RFR + RP – g
So, if we observe yields changing in a market, that should imply that one of those components – the risk free rate, the risk premium or the long run rental growth – has changed. If we cannot see what is driving the change at a fundamental level, it may well imply mispricing in the market.
It was a common experience for both practitioners and academics in the market in 2005 and 2006 that transaction prices “did not make sense”. Putting plausible assumptions of income, growth, costs and required returns into cashflow models resulted in investment values far below achieved prices. It is at this point that behavioural factors can kick in, growth rates are increased, required returns are reduced, exit yields cut to “make” the investment appraisal fit the price and the “new paradigm” arguments emerge to back those changing assumptions. Did this make sense then? Does it make sense now.
Click on the image below to explore out interactive graphic on the Commercial Real Estate Investment Ecosystem

For the risk free return, most finance texts point to government bond yields but this is only a proxy measure (in the current economic environment with suppressed redemption yields, government bonds in many countries seem more like a return-free risk). For a substantial period in advance of the global financial crisis, bond yields in the developed economies had been falling, lower bond yields imply lower required returns for real estate – but not necessarily lower cap rates.
The fall in bond yields was largely due to lower expectations of inflation: but, to the extent that rental values hedge inflation, this should have reduced long run rental growth expectations, too. In broad measure, inflation cancels out. So for a fall in cap rates to be linked to a fall in bond yields, the real risk free rate (ignoring inflation expectations) must fall – that is, investors in general have to have become less risk averse. There was a general view that that was true in the first half of the 2000s: a belief that (international) macro-economic management had reduced cyclical instability as well as inflation, feeding through into lower required returns on investment. Whatever the outcome, it was not completely irrational to hold such views, despite subsequent rewriting of history.
In the current market environment, it is more complicated to analyse the linkage between the very low government bond yields (suppressed by quantitative easing and other fiscal measures in the attempt to stabilise the financial system and generate some, any, economic growth) and cap rates. Admittedly, low bond rates feed into low interest rates, reducing the cost of capital for leveraged investors. But does this justify sharply lower cap rates, while maintaining “normal” expectations of real estate returns based on historic averages? In the two main economic scenarios, either bond yields will revert to long run (real) norms, increasing exit yields and damaging returns for any investors who have bought at low cap rates; or they will remain low due to continued poor economic performance and austerity programmes, implying lower returns over sustained periods. In either case, lowering cap rates to match suppressed bond yields is inconsistent with an assumption that real estate will deliver typical historic average long run property returns.
Cap rates would rationally fall (and values would go up) if expectations of rental growth increased. But there is much misunderstanding of this point: the growth component here is long run rental growth not short run increases in rents, particularly if these are cyclical. However, here behavioural factors and beliefs may play a role in reducing cap rates and driving up prices. For example, it is often observed that the rental levels, the rents per square metre, of major global cities are higher than those of smaller cities down the urban hierarchy. However, this does not mean that the rental increases of existing buildings necessarily increase at a faster rate. Much of the economic growth in cities does not translate into long term rental growth because supply adjusts, albeit with substantial lags. New stock may capture the uplift in rental values. Land values increase in response to growing economic strength: cities become denser to accommodate the growth in demand but for a property owner that may require redevelopment of the existing building to increase the size and/or to modernize the space offered to capture the increased land value as a rental income stream.
The City of London again provides an illustration of this. Over the 1981-2014 shown, stock of space has increased broadly in line with the increase in employment and rental growth has been dampened by major office developments on the fringes of the City as in Docklands. From 1981 to 2014, rental value growth was around 2% per annum before inflation, -1.7% after inflation. This is consistent with long run evidence: Steven Devaney’s doctoral research showed virtually no real rental growth in London offices from 1850-1950 as the City emerged as a major financial centre: long run research in New York, Amsterdam and other markets find remarkably similar results. The implication is that to capture real economic growth, an investment needs to be actively managed and held for long enough for the option to redevelop the building to become profitable. For such long term investors, acquisition of real estate in developed markets at low yields, at cap rates below long run averages may thus be rational because, over time, they pay off. But can they be rational for core, passive investors, particularly those with shorter investment horizons, finite life funds or leveraged investors with a financing constraint?
This brings me back to the issue of the cost of capital and the nature of individual investors. The globalisation of real estate investment has introduced new players into property markets, investors who may have very different characteristics than the traditional players. Major global real estate investors face lower portfolio risk because they have diversified away much of the domestic risk in their portfolios; they have access to cheaper sources of capital, both debt and equity and hence have lower costs of funds. Their reference risk free rate is a global rate or what prevails in their country of origin, not the local bond rate. As a result, when global real estate investors invest outside their home country, their required returns may be lower, sufficiently low to more than offset their information disadvantages and higher search costs compared to local investors. Furthermore, where those investors have long time horizons or are not subject to short run market pressures to realise capital – for example, the sovereign wealth funds – then they do not have the same requirement for the liquidity premium that finite life funds and firms require.
As such investors increase as a share of market participants, as the marginal buyer (what is a marginal buyer?) becomes a well capitalised, non-domestic investor, then cap rates might be influenced downwards, reflected higher asset prices. The City of London again provides an illustration: the University of Cambridge’s latest Who Owns the City research suggests that nearly two thirds of office space in the City is held by non-domestic investors, who also dominate ownership of newly developed space in the market. If this has resulted in a downward movement in yields, then it should raise questions about the expected returns and risks for investors without those long run global characteristics. There is also a risk that (possibly rational) lower yields in such globalised markets influence falling yields in other markets which do not have the same characteristics – artificially inflating prices.
One other implication of this global trend is that investment is increasingly concentrated in a small set of cities that offer substantial high value assets for investors with a need to place vast amounts of capital quickly and without distorting the market. These major cities offer scale economies and are served by global service providers. Real Capital Analytics data for major office transactions in the period 2007-2014 showed that over 50% of investment by value went to just ten cities, over 75% to the top 25 ranked cities. Furthermore, the head quarters of the owners of that real estate are predominantly located in those same cities, which are the source of debt and equity for the investors. This emphasises the locking together of investment, occupational and financial interests in office markets in major cities that I set out in Towers of Capital and raises questions about exposure to systemic risk and the contagion effects of capital market shocks propagating across globalised real estate markets. Much of the justification for holding a global real estate portfolio comes from diversification benefits: but if the funds allocated to real estate are increasingly concentrated in markets with the same economic drivers, those diversification effects may be dissipated. In effect, in the risk premium, systemic risk exposure could offset the gains from diversification and liquidity.
So is the cap rate the best early warning indicator of market overheating, the canary in the coalmine? Probably not of itself: structural changes to markets and the characteristics of investors can lead to rational shifts in the yield. But it is a very important indicator, nonetheless. Investors, analysts and regulators, observing cap rate shifts need to ask what is driving that change and to analyse the fundamental components of the cap rate. Is there any reason to assume there has been a structural and sustainable change in the (real) risk free rate? Why would the risk premium have changed? Is there any reason to think that long run real rental growth will be higher in the future (remembering that supply will adjust to demand)? Have the characteristics of investors in the market permanently changed such that required returns have altered? If none of those hold, then buyer beware.
Author: Colin Lizieri, Grosvenor Professor of Real Estate Finance, University of Cambridge, United Kingdom
Image: A view of semi-detached homes in Bexleyheath, southeast London, May 12, 2014. REUTERS/Suzanne Plunkett
Don't miss any update on this topic
Create a free account and access your personalized content collection with our latest publications and analyses.
License and Republishing
World Economic Forum articles may be republished in accordance with the Creative Commons Attribution-NonCommercial-NoDerivatives 4.0 International Public License, and in accordance with our Terms of Use.
The views expressed in this article are those of the author alone and not the World Economic Forum.
Stay up to date:
Real Estate
Related topics:

Forum Stories newsletter
Bringing you weekly curated insights and analysis on the global issues that matter.
More on Financial and Monetary SystemsSee all

Jaime Magyera
November 13, 2025


