155 years of oil prices - in one chart

The history of oil prices, in one chart. Image: REUTERS/Nigel Roddis
Oil has been center stage since late 2014.
Most recently, after two years of depressed prices, OPEC agreed to curtail output by 1.2 million barrels per day at its meeting in Vienna in late November in an attempt to end the global supply glut. Several non-OPEC producers including Russia tagged along in December, agreeing to reduce output by about 560,000 bpd (slightly below the original proposition of 600,000).
Oil prices jumped on the news and are now about 18% higher than they were before the November announcement. WTI crude is trading around $53.62 per barrel, while Brent crude is around $55.78 per barrel as of 9:28 a.m ET 20 December.
Looking forward, a Goldman Sachs macro research team wrote in a note to clients that they see Brent crude oil prices peaking at $59 per barrel in the first half of next year as cuts are implemented. That should push the market into deficit in the first quart of next year, "which should shift the market into backwardation by the summer." They added that the "key" thing to watch will be OPEC's compliance and whether non-OPEC members deliver on their promised contribution.
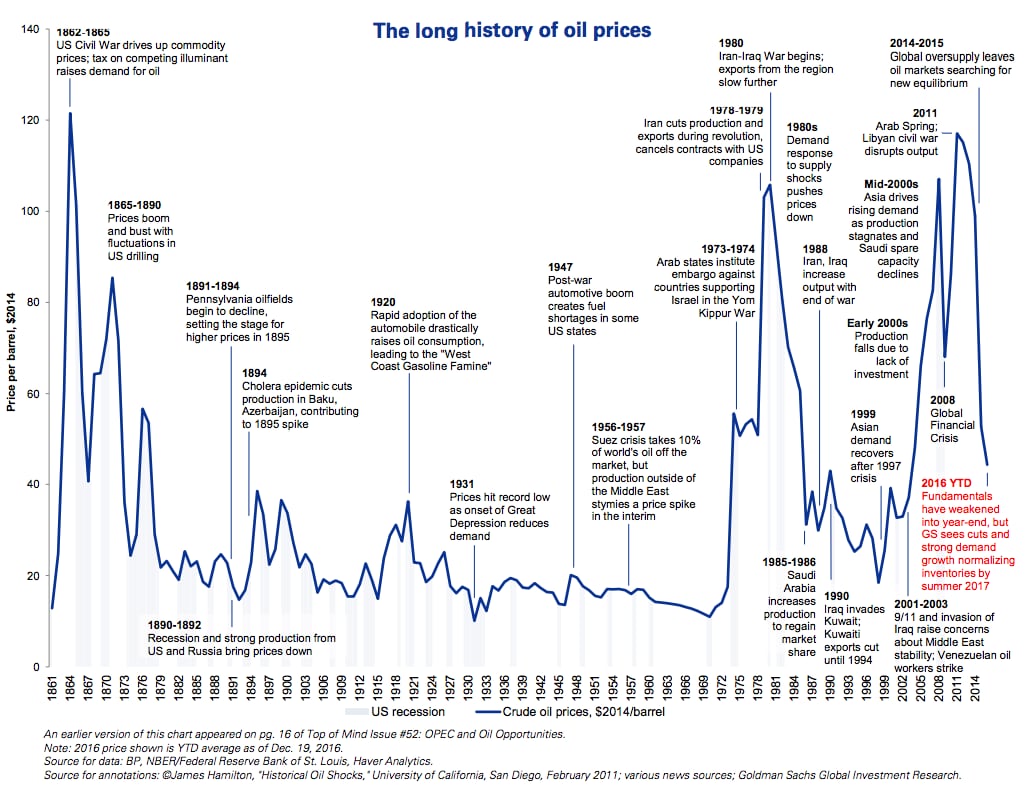
Notably, the oil-price volatility of the last two years is not without precedent.
The Goldman team also included a chart showing the 150-plus year timeline of oil prices (in 2014 US dollars) and related historical events.
For example, prices rose in 1895 after a cholera epidemic led to production cuts in Baku, Azerbaijan, and dropped to a record low in 1931 as demand plummeted during the Great Depression.
Don't miss any update on this topic
Create a free account and access your personalized content collection with our latest publications and analyses.
License and Republishing
World Economic Forum articles may be republished in accordance with the Creative Commons Attribution-NonCommercial-NoDerivatives 4.0 International Public License, and in accordance with our Terms of Use.
The views expressed in this article are those of the author alone and not the World Economic Forum.
Stay up to date:
Oil and Gas

Forum Stories newsletter
Bringing you weekly curated insights and analysis on the global issues that matter.


