Winners, losers and future prospects: The economic geography of transition countries

The world's population continues to move towards cities and urban areas. Image: REUTERS/Chris Helgren
Spatial inequality, as epitomised by the urban-rural divide, has become a major policy concern in recent years. The shifting fortunes of different geographic regions affect employment opportunities (Moretti 2012), political polarisation (as apparent from the 2016 US presidential election and the Brexit referendum; see Becker et al. 2017), and health outcomes (Chetty et al. 2016). In a recent article on the changing landscape of opportunity, The Economist (2017) argued that frictions to relocation inflict damage on already vulnerable segments of society. Eastern Europe and Central Asia are no strangers to these global trends – in a World Bank report, Cadavid et al. (2017) showed how cities with better geographic connections to important markets gained population, while other municipalities shrank.
Which forces shape these shifting economic fortunes across space? And what can they tell us about how the future economic geography might look like? In Chapter 4 of EBRD’s Transition Report 2018-19, we examine the impact of geographic changes on economic outcomes across Europe, Central Asia, the Middle East and North Africa (Desmet et al. 2018b). Newly available and highly disaggregated geographic data enabled us to describe the changing spatial distribution of population and economic activity. More importantly, using a quantitative spatial growth model, we projected how the region’s economic landscape is likely to evolve in the next decades.
In the last quarter century, Western Europe and the EBRD regions have experienced important changes in the spatial distribution of population.1 The rising red bars in Figure 1 indicate 10 km by 10 km grid cells where population has increased over the period 1990-2015. Population gains have concentrated in metropolitan areas and cities. Coastal regions have also gained population, as has much of Western Europe, North Africa, the Nile River and Delta, and the Mediterranean edge of the Middle East. Meanwhile, other regions, such as the Baltic States and Central and South Eastern Europe, have rapidly lost population, as illustrated by the descending grey bars in the same figure.
Figure 1 Population shifts from 1990 to 2015

To further identify ‘winners’ and ‘losers’, we construct for each square kilometre a localised population density measure.2 We find that in 45% of the countries in the EBRD regions, more than half of all people live in locations today where the localised population density has declined since 2000. While many people have moved to dense cities, a substantial number remain in areas being left behind. When comparing cities of different sizes across the EBRD regions, the ones with a population above half a million have grown fastest. Of the approximately 375 million people living in urban areas, around 60% reside in those large cities. For those living in cities with a population below half a million, at least half of their residents have experienced moderate to severe declines in their average localised density.
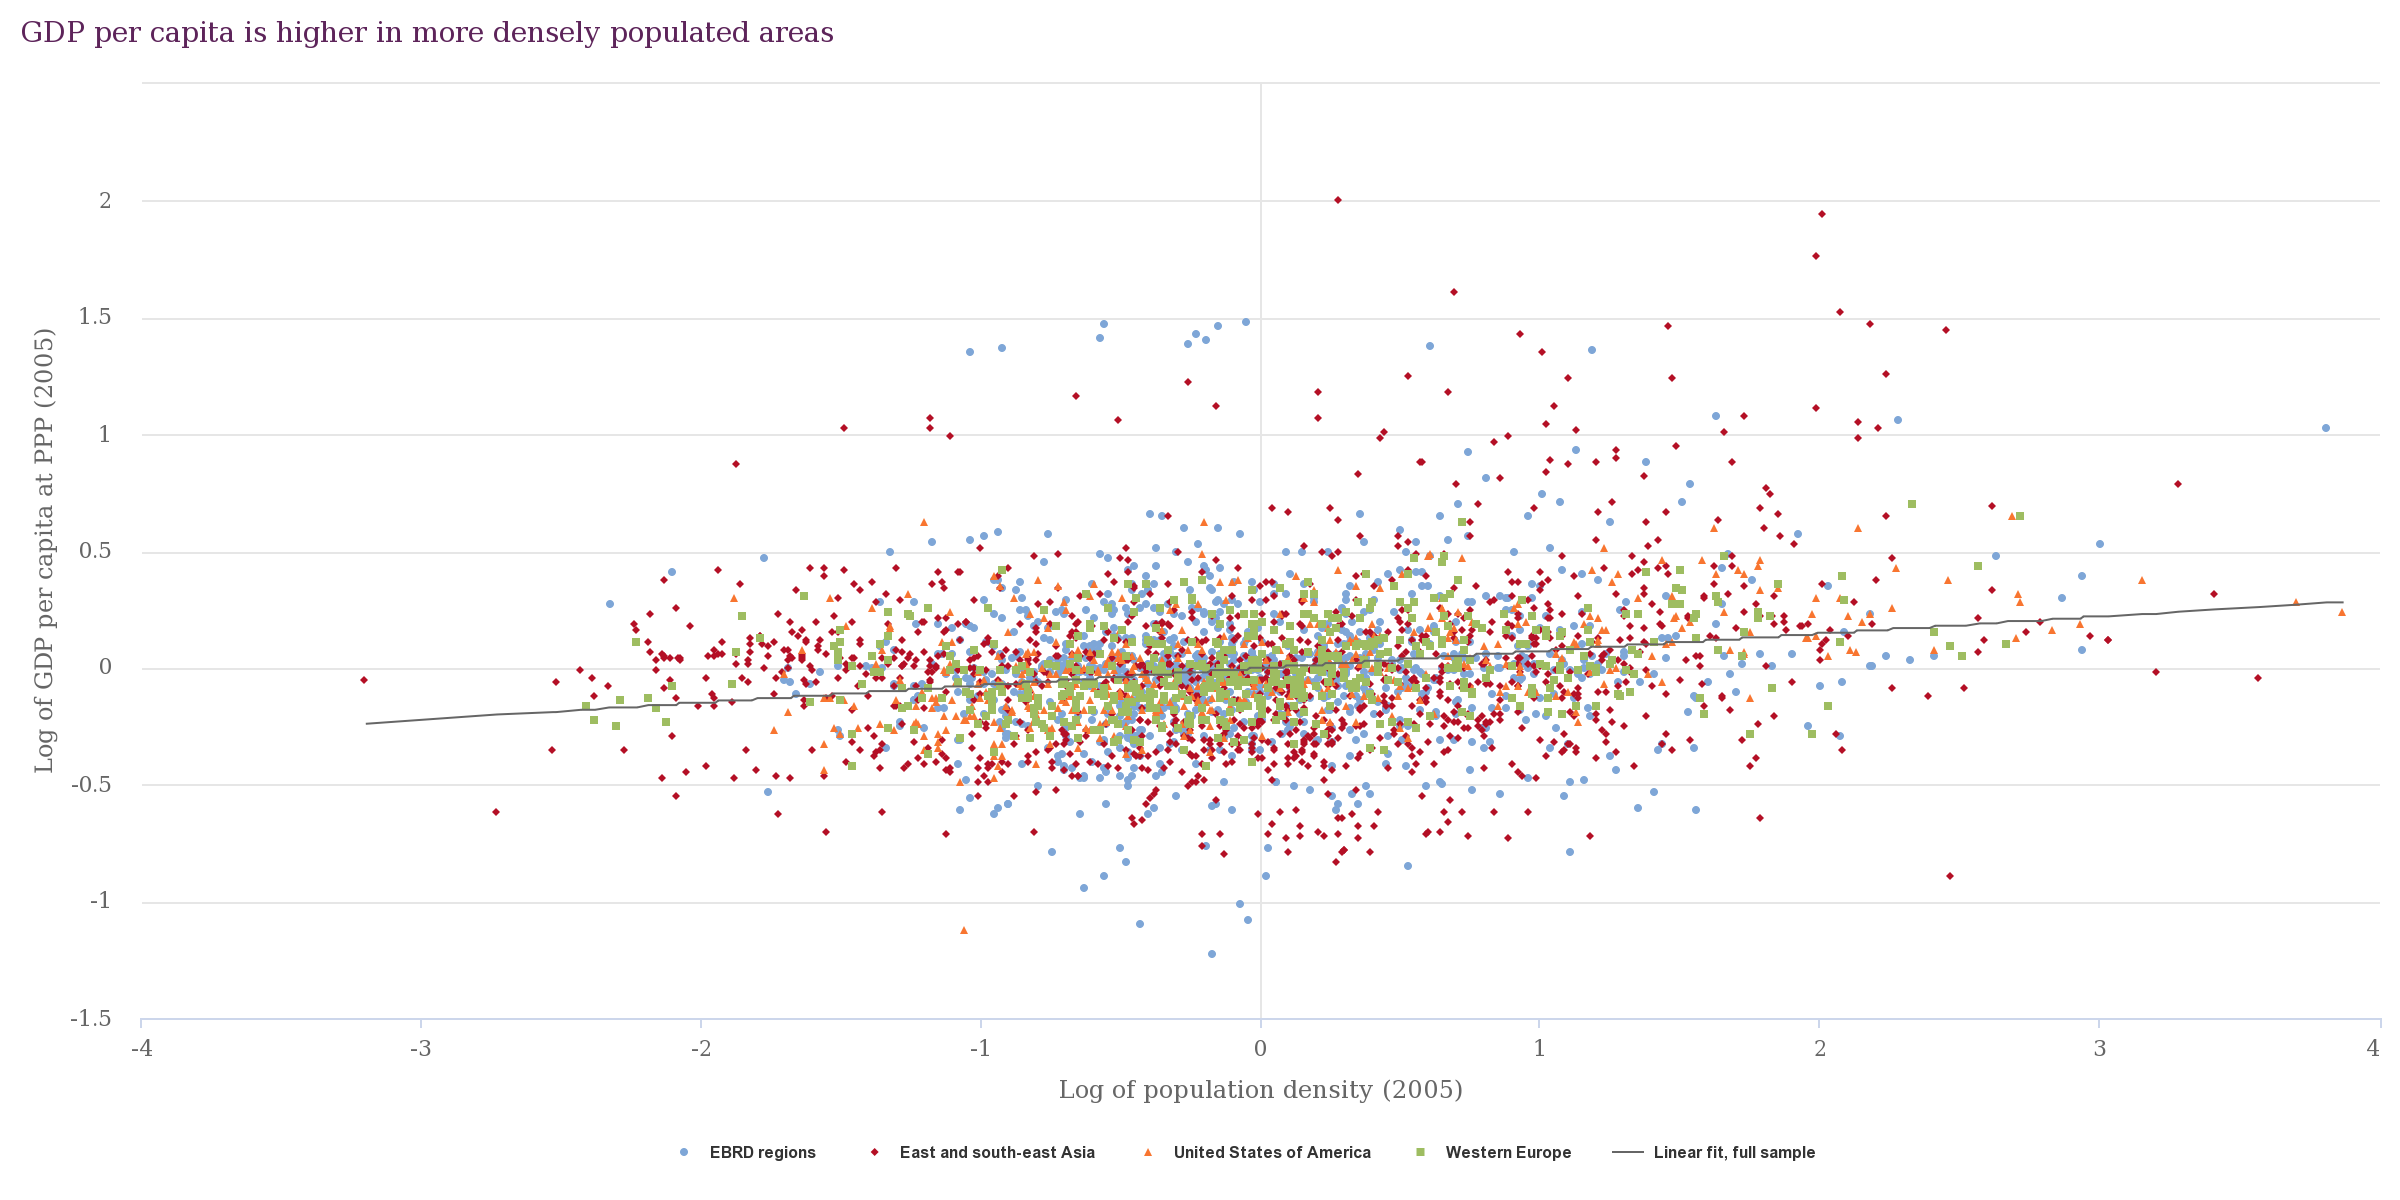
The shifting fortunes of different locations reflect changes in economic productivity across space. When plotting the relation between GDP per capita and population density at the 1° by 1° level for several regions of the world, we find a positive correlation (Figure 2). For the EBRD regions, a doubling of population density is associated with an approximately 5% higher output per capita. Further yet, places gaining density faster also increase their productivity at faster rates. Using nightlight data at a finer geographic resolution suggests these findings hold true for cities as well.
Figure 2 GDP per capita and population density
The positive relationship between density, productivity and growth is not surprising – people relocate to dense and productive areas in search of economic opportunities. Likewise, firms locate in these places to benefit from large talent pools (such as Amazon opening offices in Long Island City, NY and Arlington, VA), to be nearer to their input sources and potential buyers, and to hopefully take advantage of knowledge spillovers as ideas diffuse. Innovation and infrastructure benefit from the populace packing closely together, as investments in these locations reach a higher share of the public. Yet, density and productivity do not comprise the entire story. Higher population density often comes with well-known nuisances: pollution, congestion and high rents.
The above evidence suggests that in the EBRD regions the positive effects of density (agglomeration forces) tend to outweigh the negative effects (dispersion forces). At a fine geographic resolution, there is some heterogeneity in this trade-off. Figure 3 shows changes in localised density by square kilometre for Western Europe and portions of the EBRD regions for the period 2000-2014. When focusing on the zoom-in windows, Moscow (right) demonstrates dominant agglomeration forces, whereas Warsaw (left) shows dominant dispersion forces in the city centre. This heterogeneity across and within cities, possibly driven by changes in local infrastructure and commuting patterns, does not alter the basic finding: density is an important driver of productivity growth.
Figure 3 Changes in localised population density, 2000-2014

Despite identifying relevant patterns, the data presented so far cannot speak to how spatial growth patterns are likely to evolve in the future. This is relevant for policymakers interested in using infrastructure investments and trade policy to affect spatial growth. Maybe more importantly, the data are unable to say whether geographic shifts are welfare-enhancing or not. While agglomeration forces driving innovation create economic opportunities and generate aggregate growth, the places losing people face intensified challenges as their markets shrink.
To examine the growth and welfare prospects of the different EBRD regions, we need a dynamic spatial model that can be taken to the data. To that end, we use the framework developed in Desmet et al. (2018a), and solve the model quantitatively after incorporating economic data at the 1° by 1° level and estimating trade costs based on roads, railroads and waterways.
We find that places in the EBRD regions with the greatest population density today are projected to achieve the greatest gains in well-being in the relatively near future. The productivity gains from density in these areas, which feed into higher incomes and greater consumption, are estimated to outweigh the toll taken on amenities as local populations increase. On balance, the EBRD region is projected to perform relatively well, with growth rates of productivity, real GDP per capita and welfare outpacing the corresponding global averages by around 1 percentage point per year through 2040.
We also use the model to carry out counterfactual policy analysis. For example, we assess the expected economic impact of road and rail investments in the Western Balkans in the last years. We also consider the possible effect of the Belt and Road Initiative (BRI) and of reductions in trade costs across EBRD countries and nearby neighbours. The most interesting finding, perhaps, arises from comparing scenarios. While expansive investments along specific routes produce major reductions in transport costs along them, to the benefit of localities near these projects, much more modest reductions in existing trade costs across the entire region have the potential to provide comparable benefits to growth.
Our analysis suggests that the broad geographic changes occurring in Europe and the rest of the EBRD regions create opportunities for productivity growth and overall economic gains. The forces behind the evolving patterns of population concentrations across space are deep and pervasive. While overall positive in their effects, these changes also leave segments of the population behind in areas that become increasingly sparsely populated. As those areas lose density, their local opportunities recede as well. Policies to soften their landing, while attempting to ignite some of the agglomeration forces on which they’ve missed out, could be their best chance for achieving growth and maintaining well-being. Investments to improve local amenities such as the provision of water, healthcare and energy, and investments in local education opportunities may work well in these areas. Such policies must be implemented with caution, as they may have negative effects in the aggregate. Alternatively, measures that incentivise geographic mobility may help to improve the opportunities of residents in left-behind places.
Don't miss any update on this topic
Create a free account and access your personalized content collection with our latest publications and analyses.
License and Republishing
World Economic Forum articles may be republished in accordance with the Creative Commons Attribution-NonCommercial-NoDerivatives 4.0 International Public License, and in accordance with our Terms of Use.
The views expressed in this article are those of the author alone and not the World Economic Forum.
Stay up to date:
Geo-economics

Forum Stories newsletter
Bringing you weekly curated insights and analysis on the global issues that matter.
More on Geo-Economics and PoliticsSee all

Belén Garijo
December 9, 2025


