This is why countries with high debt are stuck in a 'doom loop'

The debt threat. Image: REUTERS/Yannis Behrakis
The view that deficits and higher public debt can be beneficial received an important boost via Olivier Blanchard’s 2019 presidential address at the American Economic Association (Blanchard 2019).
Blanchard’s analysis is based on a workhorse model of the economic theory (Diamond 1965), which implies that an increase in government debt might be welfare-enhancing if the growth rate of the economy is higher than the interest rate. The exact result depends considerably on the available production technology, but the key condition for positive welfare effects is the difference between the growth rate and the interest rate.
Blanchard also acknowledges that higher debt leads to higher risks. Experience shows that, above a certain threshold of debt, the (market) interest rate on public debt increases with the debt level (as a percentage of GDP). This has been confirmed by many empirical studies (e.g. Laubach 2009, Ardagna et al. 2007, and Engen and Hubbard 2004), and plays a key role in debt sustainability analysis (DSA) exercises. For example, the IMF’s (2017) and the European Commission’s projections of debt in Greece use a simple rule of thumb that the risk premium, defined as the difference between the riskless rate and the interest rate on public debt of any particular country, increases by 3 to 4 basis points for every one percentage point increase in the debt to GDP ratio above 60%.1
This link between the cost of debt and the level of debt itself is not just a minor inconvenience. It has profound implications for high debt countries, in particular for the high debt countries in the euro area where each government is responsible individually for its own debt.
In this column, we focus on two implications of the feedback loop between sovereign debt and risk premium:
- First, the marginal cost of debt is usually much higher than the market interest rate.
- Second, small differences in the initial debt ratio can lead to very different debt trajectories.
Average versus marginal cost of debt
A first, a general implication of the empirical regularity that the risk premium depends on the debt level is that the marginal cost of public debt is much higher than the interest rate on public debt (which represents the average cost). Intuitively, this is straightforward – if a government incurs more debt it has to pay interest on that additional debt. However, by incurring more debt the risk premium will increase, thus increasing the cost of refinancing the entire stock of existing debt. This second effect can be very important if debt is high.
With the rule of thumb of the IMF that the risk premium increases by 4 basis points for every percentage of the debt GDP ratio above 60% (for the European Commission, this ‘elasticity’ is only 0.03),2 one can calculate the average cost of debt for a country like Italy. With a debt-to-GDP ratio of 130%, i.e. 70% above the 60% threshold, the predicted risk premium should be 280 basis points (against 210 basis points based on the Commission’s elasticity of 0.03). These values appear realistic. Since the middle of 2018, Italy’s risk premium has fluctuated around the upper end of this range.3
With a risk-free rate (that on German government bonds) close to zero, the risk premium is equal to the (long term) interest rate, which is now around 2.3% for Italy. However, the marginal cost of additional debt is much higher than the interest rate. Assuming a debt level at 130% of GDP and the risk premium of 280 basis points, total interest expenses will amount to 3.64 (= 2.8*130)% of GDP.
The marginal cost of debt can be seen through a thought experiment. Assume the country reduces its debt-to-GDP ratio to 110% of GDP. The risk premium would then fall to just 200 basis points and the total debt service cost would fall to 2.2 (= 2*110)% of GDP. The government would thus gain about 1.4% of GDP in lower debt service although the debt ratio has fallen ‘only’ by 20%. The marginal gain from each 1% reduction in debt would thus be 1.4/20, or about 7%, much more than the interest rate at the higher debt level.4
This marginal gain or cost is, of course, not directly visible and has little impact on political discussions as it materialises only slowly through higher interest expenses over time. By contrast, the interest rate is visible and seemingly represents the cost of issuing additional debt. But this example shows that, in reality, the marginal cost of public debt is much higher than one would expect simply looking at interest rates. Current market rates on Italian debt might look sustainable, but the implicit cost of not reducing debt is very high.
Risk premium and debt levels: The doom loop
The link between the risk premium and the debt level (as a percentage of GDP) introduces an important self-reinforcing mechanism, which can easily lead to a significantly different debt paths even if the initial conditions change only marginally.
The reason is simple – at a higher debt level, the interest rate cost of debt will be higher not only because there is more debt to service, but also because the cost of each unit of debt (i.e. the interest rate) will increase.
An example can illustrate this mechanism, taking again a debt ratio of 130% of GDP as the benchmark. At this level, steady-state interest payments should amount to 3.64% of GDP as calculated above. But if the debt ratio were to increase to 150% of GDP, the risk premium (and interest rate) would increase to 3.6%. Over time, interest expense would then increase to 5.4 (= 150*3.6)% of GDP. With these higher interest payments, the debt level would increase even more – unless the country in question starts to run a much larger primary surplus. At a constant primary surplus, the feedback loop between debt and risk premia can thus be unstable (in both directions).
Moreover, even seemingly small changes in the multiplier effect of the debt ratio on the risk premium have a very strong impact on debt dynamics. This is illustrated in Figures 1 and 2. The five lines in the figures show the evolution of the debt ratio over 20 years, assuming in all cases a constant primary surplus of 3% of GDP, but starting from different levels, e.g. 150% of GDP for the uppermost line (D0150), 140% of GDP for the second line, and so on, with 110% of GDP representing the lowest starting point.
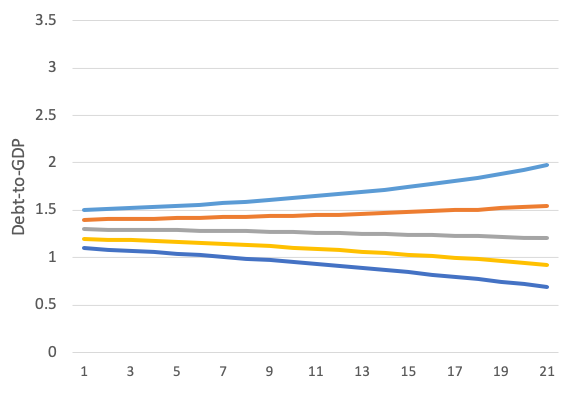
Figure 1 shows the evolution of the debt ratio using the elasticity, α, of 0.04, from the IMF, while Figure 2 uses α = 0.03, following the Commission’s assumption. All other assumptions (growth rate, riskless rate, and constant primary balance) are the same in both cases.
A comparison of the two figures shows that this small difference in one parameter leads to a very different dynamic of the debt ratio. At one extreme, i.e. starting from a debt ratio of 150% of GDP, the parameter of the IMF would lead to over 320% of GDP in 20 years, whereas the parameter of the Commission would lead to a debt ratio of ‘only’ 200% of GDP. In both cases, debt would not be sustainable. However, comparing the middle line in both figures shows that, starting from a debt ratio of 130%, the IMF and the Commission would arrive at different conclusions concerning the sustainability of debt. For the IMF, this level would be unsustainable since debt would increase to over 160% of GDP; for the Commission, this debt would be sustainable as it would fall in 20 years to about 110% of GDP.
Figure 1 Dynamic evolution of debt-GDP ratio from different starting levels (α = 0.04)
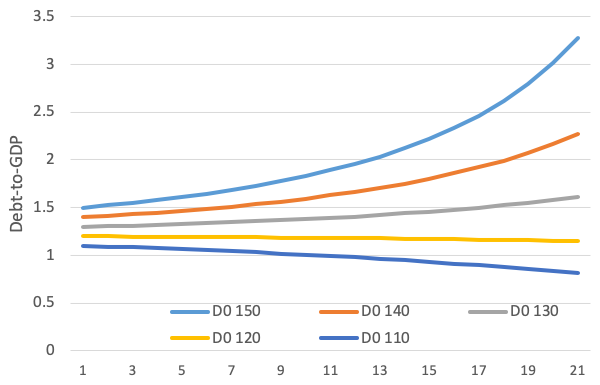
Figure 2 Dynamic evolution of debt-GDP ratio from different starting levels (α = 0.03)
Source: Alcidi and Gros (2018).
Notes: Basic assumptions: constant 3% primary surplus and risk -ree rate equal to growth rate. The risk premium increases by 4 basis points for every percentage point increase in debt ratio above 60% of GDP (IMF assumption, left hand panel) or by 3 basis points for every percentage point increase in debt ratio above 60% of GDP (Commission assumption, left hand panel). D0 110 stands for Debt at time 0, equals 110% of GDP, D0 120 stands for Debt at time 0, equals 120% of GDP etc.
These illustrative calculations show that under realistic parameter constellations, a debt ratio of 130% of GDP constitutes a critical threshold, where the line between sustainability and unsustainability is very thin. With a debt ratio above this ‘reference value’, a government might struggle to cope with the cost of debt. Below this value a self-reinforcing loop can set it.
Conclusion
With very low interest rates, it is tempting for governments to spend more. However, while risk-free rates hover around zero in the euro area, high-debt countries face considerable risk premia that can lead to a feedback loop in which high-risk premia lead to higher debt, which in turn leads to ever higher risk premia.
This column has focused on the longer-term link between risk premia and public finances, taking growth as given. The conclusion that high debt creates a danger of doom loops will be reinforced if one takes into consideration spillover effects for the private sector. The financing costs of banks and large enterprises are usually linked to the risk premium on the sovereign. This implies that a higher debt level is likely to depress growth. It is this channel that leads to the conclusion that for a high-debt country, a fiscal expansion can be contractionary.5 Low risk-free rates should not be taken as a justification to increase public debt above a certain threshold.
Don't miss any update on this topic
Create a free account and access your personalized content collection with our latest publications and analyses.
License and Republishing
World Economic Forum articles may be republished in accordance with the Creative Commons Attribution-NonCommercial-NoDerivatives 4.0 International Public License, and in accordance with our Terms of Use.
The views expressed in this article are those of the author alone and not the World Economic Forum.
Stay up to date:
Inclusive Growth Framework
Related topics:

Forum Stories newsletter
Bringing you weekly curated insights and analysis on the global issues that matter.
More on Global RisksSee all

Allison Shapira
November 14, 2025


