Air pollution: Locked down by COVID-19 but not arrested

Average NO2 levels between March and April of this year were lower than the entirety of 2019. Image: REUTERS/Willy Kurniawan
Urvashi Narain
Lead Economist, World Bank’s Environment, Natural Resources, and Blue Economy global practice- Lockdowns have had a noticeable short-term effect on global air pollution.
- As countries recover, they can grow back cleaner and stronger.
- Tackling air pollution is essential to preserving global health and protecting the planet.
Even before the COVID-19 pandemic, one of the most serious global crises of our time, many countries had come to see air pollution as a major health issue. The State of Global Air/2019 report noted that air pollution was the fifth leading risk factor for mortality worldwide in 2017, with ambient air pollution contributing to around 5 million deaths globally – or one in 10 deaths. The report found that more people were dying from air pollution-related diseases than from traffic accidents or malaria.
The lockdown to contain the spread of the virus has severely restricted economic activity, and reports are emerging from across the globe of blue skies becoming visible, in some cases for the first time in people’s lifetime. Does this, however, translate into lower levels of harmful air pollutants?
At the same time, emerging evidence suggests that air pollution worsens the health impacts of the virus, makes people more susceptible to COVID-19 and contributes towards its transmission. What do we know about this relationship?
Improvements in air quality have come at a time of unimaginable human suffering and loss of livelihoods. These improvements will likely dissipate as lockdowns are lifted, and economic activity resumes. Will the air once again become polluted, or is there a possibility for countries to use economic recovery programs to grow back stronger and cleaner, thereby averting another health crisis? What types of policies can enable this transition to cleaner, clearer skies?
Air pollution, COVID-19, and Building Back Better
- Do reports of blue skies translate into lower levels of harmful air pollutants? Yes and No.
- What do we know about the relationship between air pollution and COVID-19? A lot although it is not conclusive yet.
- Can countries grow back cleaner and spur economic growth? Yes.
The sky may be blue, but what does the data tell us about air quality?
This article looks at the impact of the lockdown on air quality, summarizes the literature on the relationship between air pollution and the COVID-19 virus, and suggests policy recommendations for countries to build back better.
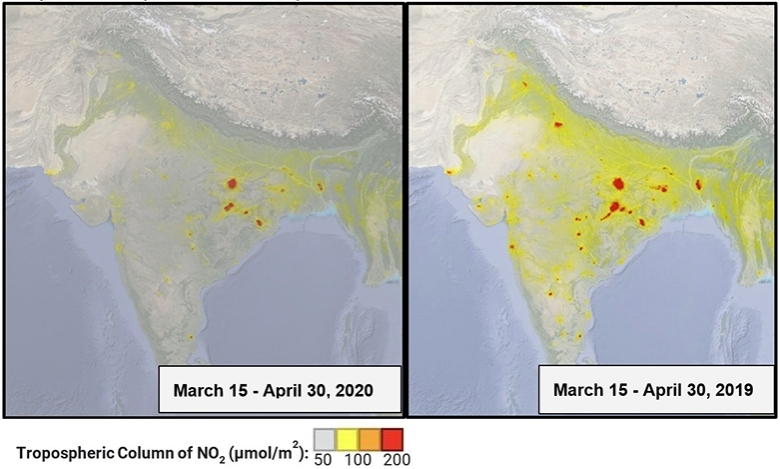
The lockdown imposed in at least 89 countries, affecting over half of the world’s population, has severely restricted economic activity globally with the unintended consequence of reducing air pollution. Reports have emerged globally of blue skies becoming visible, in some cases for the first time in people’s lifetime. Satellite data of nitrogen dioxide (NO2) concentration levels around the time of the shut-down compared to NO2 levels during the same period in 2019, show stark reductions. Using data from Sentinel 5-P satellite (see figure 1), similarly, shows that in lockdown areas, average NO2 levels in 2020 for the period March 15 to April 30 were lower than levels in 2019. Figure 2 similarly shows this for India. These results were expected as vehicular traffic, one of the main sources of NO2 emissions, was dramatically reduced during the lockdown. The analysis has also drawn attention to the remarkable technological progress made to measure pollution – satellite data has made it possible to measure NO2 levels in near real-time globally.
Figure 1: NO2 levels declined sharply during the lock down globally
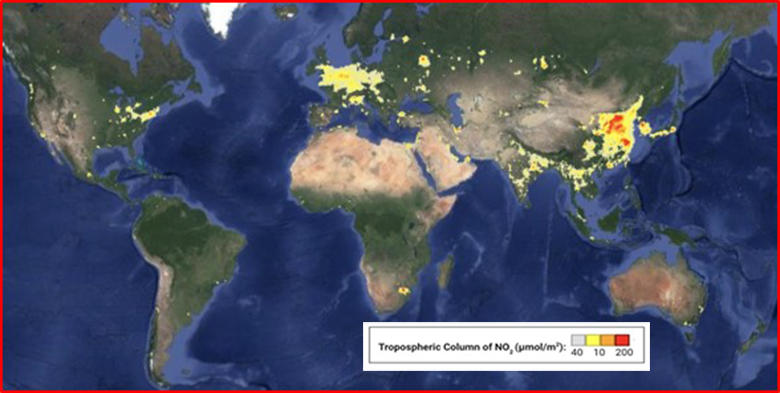
Average NO2 concentrations based on satellite data between March 15-April 30, 2019 (without lock down)
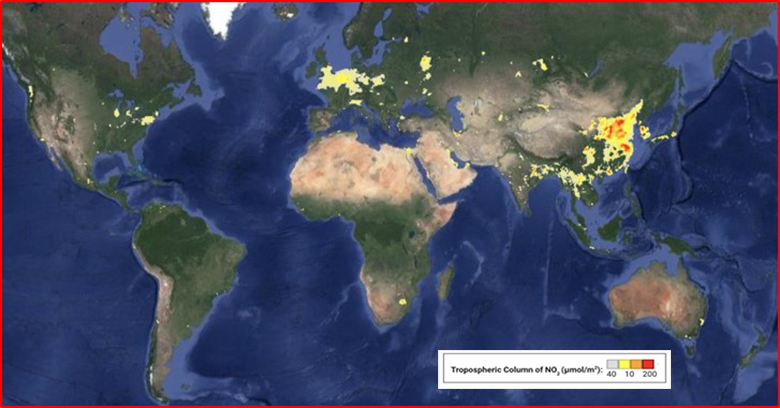
Figure 2: NO2 levels declined sharply across South Asia during the lock down
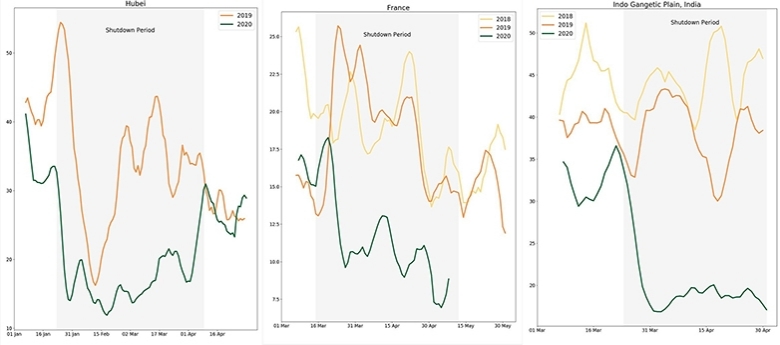
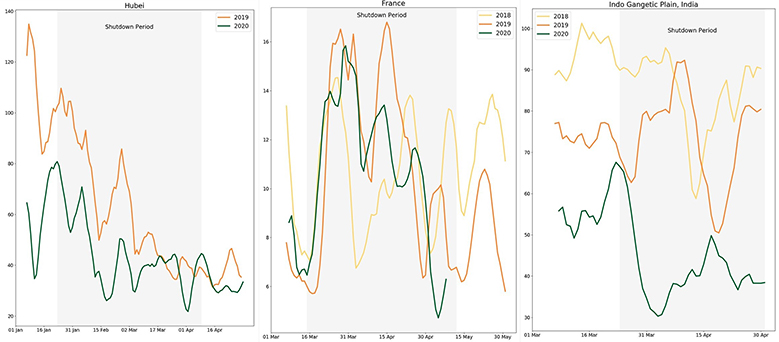
Data on NO2 levels from ground level monitors tell a similar story. Daily average concentrations of NO2 in Hubei province in China, where the city of Wuhan is located, show a steep decline as the lockdown came into force (see figure 3 – left panel). 2020 NO2 levels returned to those seen in 2019 once the lockdown ended, however. In France, data from ground level monitors also show that daily concentrations of NO2 declined during the lockdown and cessation of vehicular traffic (see figure 3 – center panel). The impact was even more stark in the Indo Gangetic Plain (IGP), one of the most polluted regions in India – as shown in figure 3 (see the right panel).
Figure 3: NO2 levels declined sharply in Hubei (China), France, and IGP (India) during the lock down
The data was downloaded from here.
View full image here.
But does this decline in NO2 levels imply that people are being exposed to lower levels of harmful pollutants? One of the most dangerous forms of air pollution are very fine particulates capable of penetrating deep into the lungs and entering the bloodstream. Known as PM2.5, these particulates have an aerodynamic diameter of less than 2.5 microns—about one-thirtieth the width of a human hair. Exposure to PM2.5 can cause such deadly illnesses as lung cancer, stroke, and heart disease.
How did the lockdown affect PM2.5 levels? Satellite data do not provide accurate estimates of PM2.5 in real time, and data from ground level monitors is required.
These data suggest that the impact of the lockdown is not as stark (figure 4).
Figure 4: Impact of lock down on PM2.5 level was not as large in Hubei (China), France, and IGP (India)
The data was downloaded from here.
In Hubei province, PM2.5 levels were lower in 2020 compared to 2019, but this was the case even prior to the lockdown. Moreover, the lockdown coincided with a period when PM2.5 levels decline seasonally. In France there was no change in PM2.5 levels after the lockdown. And in India’s IGP, as in Hubei, PM2.5 levels in 2020 were lower both before and after the lockdown when compared to 2019, potentially the result of government programs to control air pollution or meteorological factors or economic slow-down in the country. PM2.5 levels did decline further after the lockdown was imposed though in the IGP.
The picture is also mixed at the city level.
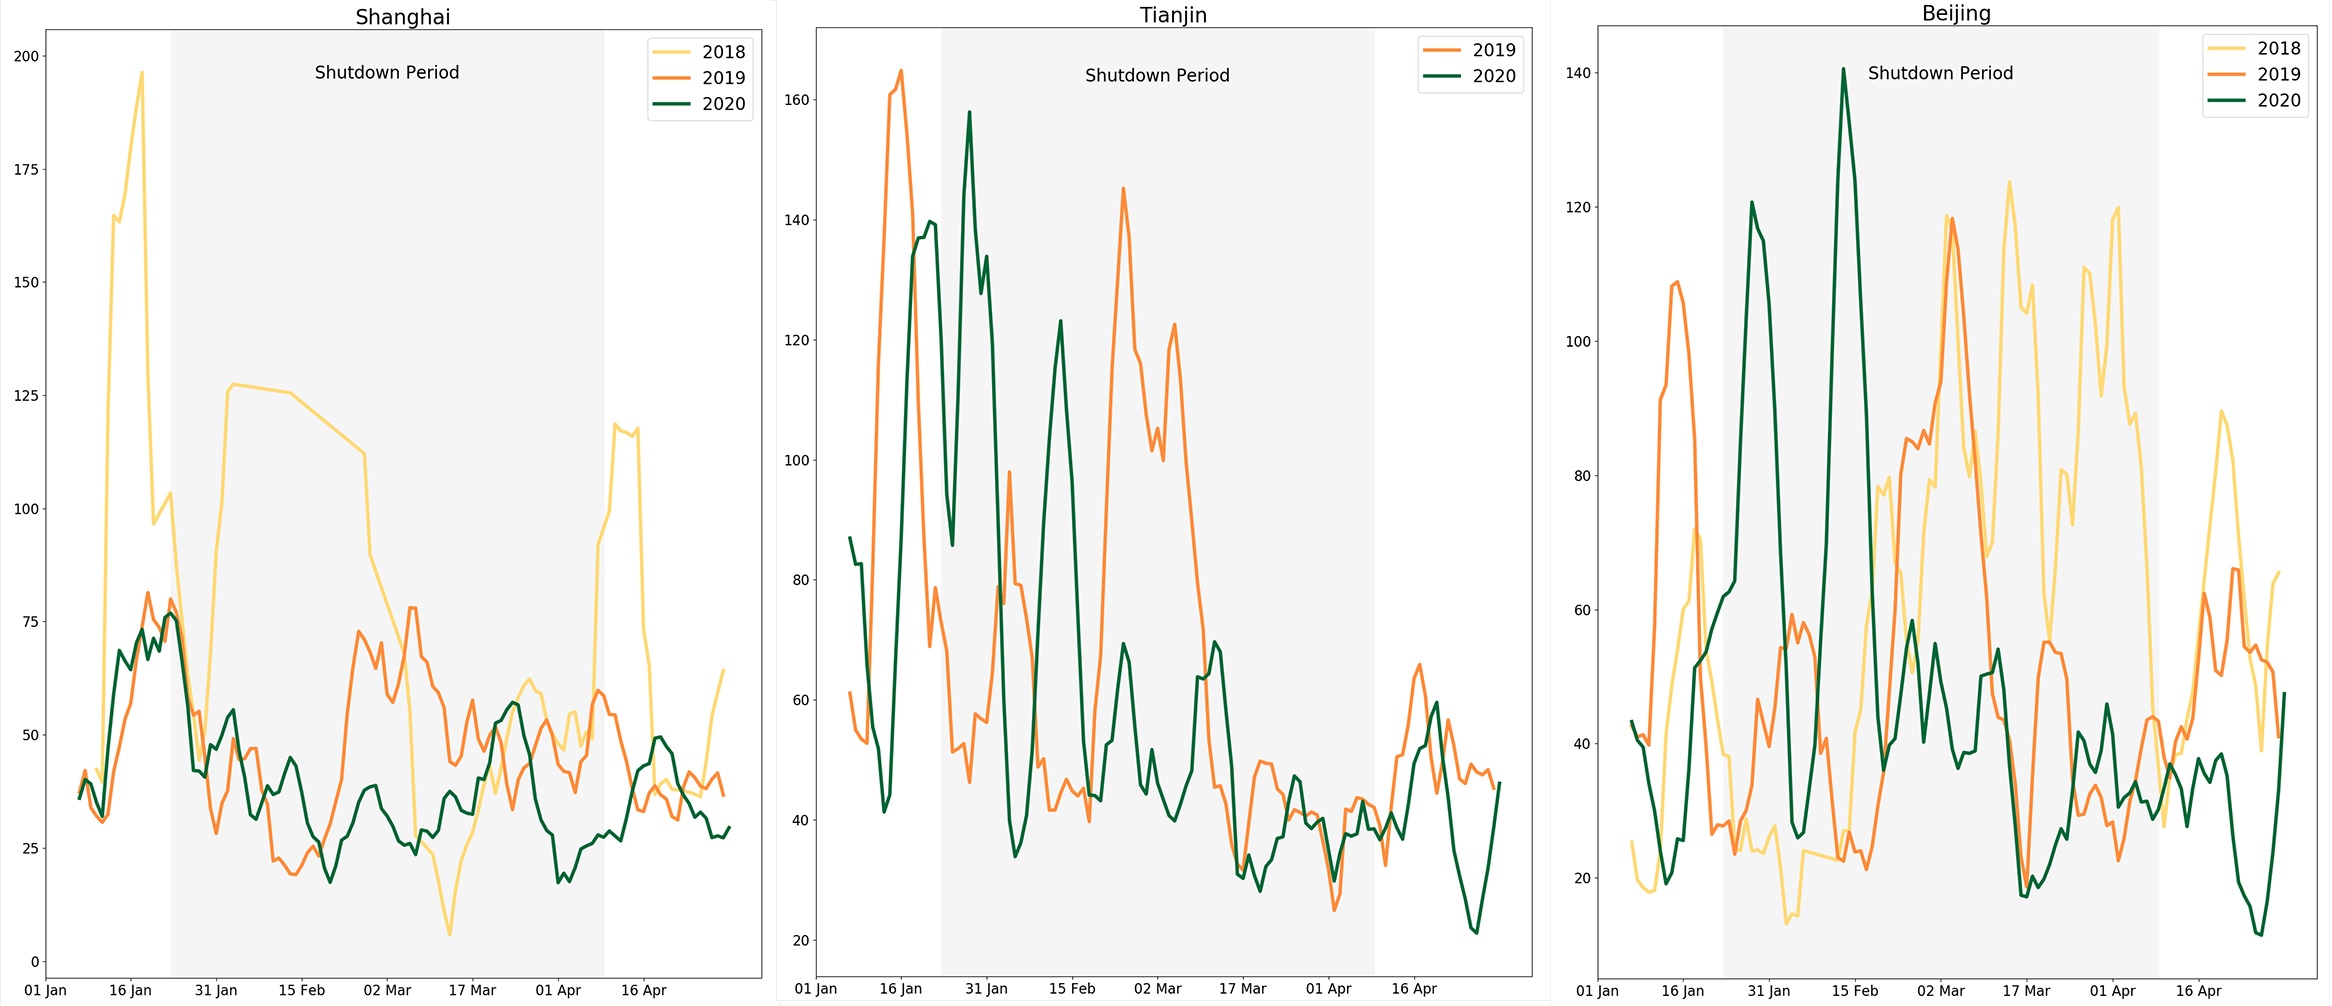
Surprisingly, there was no difference in PM2.5 levels in the Chinese cities of Shanghai, Beijing, and Tianjin as a result of the lockdown (figure 5).
Figure 5: No impact of lock down on PM2.5 levels in Chinese cities
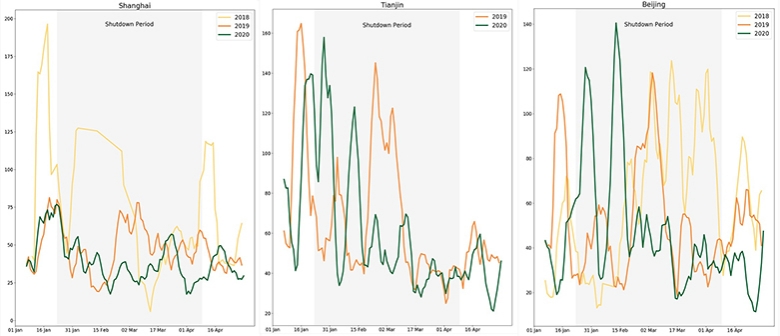
Figure 6: Mixed impact of lock down on PM2.5 levels in Indian cities
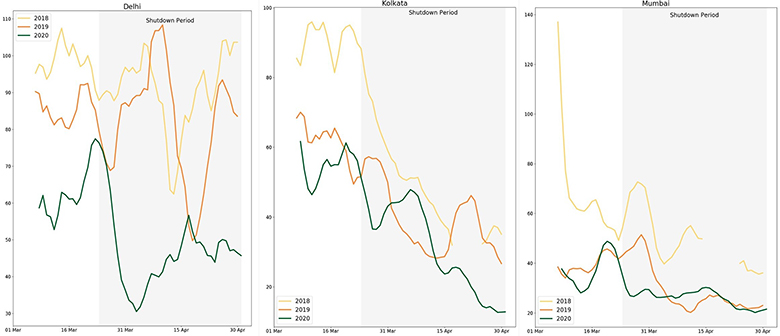
Source: World Bank Staff. Notes: OpenAQ data was obtained for PM2.5 and NO2 measurements from ground level monitors ) for India, China and France. CPCB data was combined with the OpenAQ data to fill in gaps for India. The data was downloaded from here. View full image here.
PM2.5 levels declined in Delhi for about 10 days after the lockdown (figure 6, left panel). Interestingly, 2020 levels were lower than PM2.5 levels in 2019. In Kolkata the decline came over three weeks after the lockdown (figure 6, center panel). There was little difference between 2019 and 2020 levels in Mumbai (figure 6, right panel) and concentration levels were consistently lower in Mumbai than Delhi or Kolkata.
The smaller, or lack of, reductions in PM2.5 concentrations reflect the fact that PM2.5 has a complex source structure and not all sources of PM2.5 were affected by the economic lockdown. Some of the most common sources include emissions from burning fossil fuels such as coal or oil and solid biomass such as wood, charcoal, or crop residues. PM2.5 can also come from windblown dust, including natural dust as well as dust from construction sites, roads, and industrial plants. Apart from direct emissions, PM2.5 can be formed indirectly (known as secondary PM2.5) from chemical reactions involving other pollutants such as ammonia (NH3) mixed with sulfur dioxide (SO2), nitrogen dioxides (NO2). In addition, PM2.5 can remain suspended in the atmosphere for long periods of time and travel hundreds or thousands of kilometers. The lockdown has had a range of impacts on different sources of PM2.5 at different geographical locations, illustrating these surprising trends.
In summary, air quality has many components and improvements were not consistent as a result of the economic lockdown, particularly when it comes to the pollutant that is the most harmful to human health – PM2.5.
Why does this matter at this time of the COVID-19 health crisis?
The COVID-19 pandemic is a serious health crisis that has triggered the worst economic crisis of our time. But this is not the moment for policymakers to turn their focus away from the health impacts of air pollution. Why?
For one, air pollution remains a challenge and the health consequences of poor air quality are still being experienced across society.
Perhaps more significantly in the context of COVID-19, numerous studies suggest a correlation between air pollution and COVID-19 infections.[1] Epidemiologists explain these empirical findings by noting that air pollution can affect the COVID-19 pandemic in three ways: increasing transmission, increasing susceptibility, and worsening the severity of the infection. Transmission of the virus is believed to be via the airborne spread of droplets from an infected person especially when they sneeze or cough. Since coughing is a common response to air pollution, air pollution is likely to enhance transmission. Furthermore, air pollution can increase susceptibility to the infection. In the upper airways where viral droplets are most likely to deposit, cells lining the airways have hair-like features called cilia. These cilia move mucus which has trapped viral particles towards the front of the nose to be expressed into a tissue paper or down the throat to be swallowed, thus preventing the virus from entering the lungs. Air pollution degrades these cells so that the cilia are no longer present or functional, making the person more susceptible to the COVID-19 infection. Lastly, there is a growing understanding that individuals with pre-existing chronic diseases (cardiac, diabetes, non-asthmatic chronic pulmonary disease, and chronic kidney disease) make up the majority of those hospitalized for COVID-19. Air pollution is a risk factor for all these diseases, and thereby contributes to the severity of the infection.
At this stage, the links between COVID-19 and air pollution cannot be considered conclusive given that accurate counting of cases or even COVID-19 deaths is not possible, and impacts are mediated by factors such as healthcare capacity, access and individual willingness to visit hospitals. However, based on our current knowledge and as argued above, it is reasonable to expect a general link between air pollution and respiratory infections. Furthermore, during the SARS (the virus causing SARS is a close relative to that causing COVID-19) epidemic in 2003, air pollution was linked to increased SARS mortality in several studies. One study found that SARS patients from regions in China with a high Air Quality Index (AQI) were twice as likely to die from SARS compared to those from regions with low AQI.
In summary, air pollution is a risk multiplier that is likely exacerbating the health consequences of the COVID-19 pandemic. This remains a concern since air quality has not improved uniformly during the pandemic.
What should policymakers do?
- At a minimum, government programs to control air pollution should stay on track, and countries should not relax environmental regulations as part of economic recovery programs.
- Moreover, activities that could lead to short-term spikes in air pollution – crop residue burning, for example -- ought to be discouraged. The Department of Ecology in the U.S. State of Washington called for burning bans – restricting or postponing any unnecessary burning – to help contain the health crisis from the COVD-19 pandemic. In the same vein, the Government of India’s efforts to provide free access to LPG cylinders for cooking to women in poor households are commendable as a safety-net policy intervention and a policy to contain the pandemic.
- Finally, given that decisions taken now to spur economic recovery will lock the type of economy that will emerge for some time to come, and given that governments will lack funds to invest in public goods such as clean air due to the debt they are accumulating, there is a strong economic case to spur both growth and improve environmental outcomes now. Is this possible?
Can countries grow back cleaner, spurring economic recovery but also reducing air pollution?
What will happen once countries end economic lockdown and economic activity resumes? Will the air again become more polluted, or can countries use economic recovery programs to grow back stronger and cleaner? This is an important consideration as there is an added risk that air pollution will not only return to previous levels but will likely get worse if environmental regulations are relaxed to spur growth.
The experience of countries with green fiscal stimulus programs at the time of the 2008 economic crisis, provides some lessons and suggests it is possible to grow back cleaner.
First a definition of what we mean by green fiscal stimulus programs.
Green fiscal stimulus refers to policies and measures that help to stimulate economic activity in the short-term, create conditions for long-term expansion of output, and help improve environmental outcomes in the near and longer-term. Incentives to firms to invest in technologies to reduce air pollution – say in pollution abatements technology – by themselves do not constitute green fiscal stimulus. Additional measures to stimulate demand – through a green procurement program that sources goods from cleaner industries – are also needed. Furthermore, the green procurement program needs to be at scale so that it can help to reduce the cost of production over time and support economic expansion in the long run.
In the wake of the 2008 global financial crisis, the U.S. Government put in place a green fiscal stimulus program to rescue the automobile sector. This revived the sector and promoted the sale of energy-efficient vehicles. U.S. automotive companies received a total of US$80 billion in loans from the Troubled Asset Relief Program in 2008. Support was made conditional: companies were required to come up with ways to manufacture energy-efficient vehicles (which includes both hybrid and electrically powered vehicles) as part of their restructuring plans.This was followed in 2009 by the “Cash for Clunkers” program that provided incentives for drivers to trade in their old gas-guzzling vehicles for new, fuel efficient models, lifting the sales of new energy-efficient cars. The program is estimated to have created or saved 42,000 auto-industry-related jobs in the second half of 2009. Additionally, the program resulted in a 61 percent fuel-efficiency improvement from the cars traded, in comparison to the new cars purchased, which meant gasoline use was reduced by 72 million gallons annually. Following the bailout, auto-industry employment stabilized and then rebounded, and companies re-emerged as profitable entities. In fact, since 2009, the auto industry has added over a quarter-million jobs—236,000. New cars and trucks sold in America burn much less fuel than they did a decade ago.
Similarly, in response to the country’s second largest economic contraction in the final quarter of 2008, while also faced with climate change and pollution impacts and high dependence on imported fossil fuel, South Korea launched the Green New Deal (GND) in 2009. Through this policy directive, the government identified key projects focused on renewable energy, energy-efficient buildings, low-carbon vehicles and railroads, and water and waste management to stimulate economic growth, create economic jobs, and improve environmental outcomes. The program started with an investment plan of KRW 50 trillion (USD 38.5 billion) for 2009-2012. At the same time, additional supplementary budget was prepared as a green stimulus package. At 6.3 percent of the FY2009 budget, the supplementary budget was the largest in Korea’s fiscal history. Most significantly, this effort has given a boost to the development of green technology and the green industry in the country. The renewable energy industry has grown 6.5 times in terms of sales and 7.2 times in terms of exports since 2007. Moreover, private green investment was invigorated, with green investment by the top 30 conglomerates showing a 75 percent annual increase between 2008 and 2010. The stimulus program also created new growth engines. This includes the completion of the world’s largest electric car battery factory, second biggest globally, and one that posted a drastic turnaround from a trade deficit to a surplus in 2010.
What would a green stimulus program to support economic recovery while reducing air pollution look like?
For this, it is important to understand the source composition of air pollution. The trends on PM2.5 in fact suggest that several sectors contribute to PM2.5 concentration levels, and while transport-linked sources are important, other sectors – power generation, industrial pollution, household biomass energy use, and agriculture also contribute. A program to reduce air pollution must therefore cut across multiple sectors. Moreover, as noted above, the program would need to combine supply- and demand-side measures.
Illustrative examples of policy measures in the different sectors to reduce air pollution and support economic recovery are provided in Table 1.
Table 1: Examples of policy measures to reduce air pollution while supporting economic recovery

Table 1 only provides a few examples but there are many more measures that can promote economic recovery and improve air quality at the same time. Creating low emissions zones and pedestrian-only areas can reduce air pollution and stimulate growth of the retail economy via restaurants and shopping and is another example that is gaining traction as citizens want to maintain clean air in their cities.
In conclusion, though some elements of air quality have improved, the more harmful pollutants – PM2.5 -- are still there despite the economic lockdown. Moreover, these particles are likely increasing the transmission and severity of infection from COVID-19. Governments therefore should not turn their attention away from air pollution management during this time.
As a first step, policymakers could adopt the following measures:
- In the near-term, countries should keep air pollution control programs on track and not relax environmental regulations in the name of economic growth. Activities that could lead to a spike in air pollution in the short-term should also be discouraged.
- As governments turn their attention to economic recovery, they should embrace green fiscal stimulus programs to achieve more growth and lower pollution. This is possible.
- Finally, data is key. Countries need to measure the full range of pollutants and make this information available in real-time. A combination of ground-level monitors and satellite data will provide a more accurate picture.
** "Building a Balanced Future" is a new World Bank series that learns from COVID-19 and offers expert insights into building a sustainable, inclusive world that is more resilient to shocks.
Richard Damania, Karin Kemper, Susan Pleming, Elizabeth Mealey, Karin Shepardson, Martin Heger, Daniel Mira-Salam, Ernesto Sanchez-Triana, Yewande Awe, Jostein Nygard, and Dafei Huang contributed to this story. Nagaraja Rao Harshadeep, Hrishi Patel and Rochelle O’Hagan supported the story with data analysis.
Don't miss any update on this topic
Create a free account and access your personalized content collection with our latest publications and analyses.
License and Republishing
World Economic Forum articles may be republished in accordance with the Creative Commons Attribution-NonCommercial-NoDerivatives 4.0 International Public License, and in accordance with our Terms of Use.
The views expressed in this article are those of the author alone and not the World Economic Forum.
Stay up to date:
Future of the Environment
Related topics:

Forum Stories newsletter
Bringing you weekly curated insights and analysis on the global issues that matter.
More on Nature and BiodiversitySee all

Mateo Labaki and Naeem Adam
June 30, 2026


