This is the problem with ranking the world's most liveable places

A women walks through an avenue of trees in Vienna - the world's most liveable city, according to the Economist Intelligence Unit Image: REUTERS/Heinz-Peter Bader
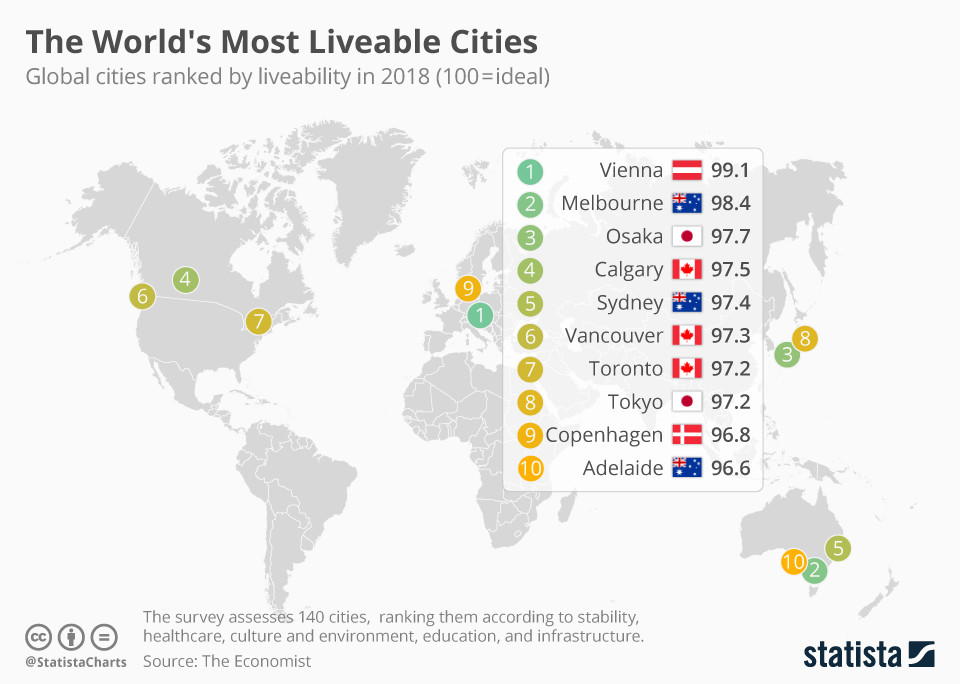
The Economist Intelligence Unit (EIU) recently released its annual Global Liveability Index 2018 (GLI). The Index ranks 140 cities worldwide on factors such as social stability, culture and environment, healthcare, education and infrastructure. Vienna, Austria, topped the 2018 list surpassing 2017’s leader of Melbourne, Australia.
Lists such as the GLI cause a lot of buzz. They’re a source of pride for citizens and marketing opportunities for cities in high-ranking positions.
The true benefits from such an index cannot be realized, however, because the proprietary methodology and steep cost for the data used to calculate the rankings limits how useful it is to the communities on the list.
The power of data lies in its ability to inform decision-making and to enhance the accountability of decision-makers. When leaders and citizens access open, community-level data based on a broad range of well-being indicators, policies and decisions can be made in an informed manner. When data is open, communities can make decisions that impact “liveability”.

The 17 UN Sustainable Development Goals (SDGs) address challenges that both rich and poor countries face, such as climate change, poverty and hunger, as well as the need to create the jobs and workforce that will drive us forward in the 21st century. A vital feature of the SDG framework is that it is measurable. More than two hundred indicators are used to track implementation and provide information about where progress remains slow and where complementary or competing targets may exist.
While the primary responsibility for reporting data to identify the progress made toward achieving the SDGs is at the national level, cities around the world recognize the value of tracking their own progress. This July, during the UN High-level Political Forum on Sustainable Development (HLPF), where states convene annually to assess their progress on the SDGs, New York City stepped up as the first municipality to formally present their plan, and progress, in implementing the SDGs, through a Voluntary Local Review. Speaking at an HLPF side event, a New York City official said the compelling presentation of data in OneNYC has set off a frenzy of requests to build local data dashboards tracking everything from traffic volumes to urban deer deaths.
Likewise, citizen groups and regional-level governments are recognizing the value of localizing the SDGs, including by collecting and using data to drive decision-making. Winnipeg’s Community Indicator System, Peg, is the first of its kind in Canada to connect local indicators to the SDG framework and transparently report on the city’s progress.
Other US communities are also tracking progress. In Hawaii, prior to the release of the SDG Framework in 2015, Hawaii Green Growth developed the Aloha+ Challenge, a dashboard of sustainable development indicators. The Aloha+ Challenge has since matched its indicators to the SDGs to encourage conversation and action to improve sustainability and living conditions on the island; an effort that’s gained enough traction to survive a significant change in state political leadership.
The Baltimore Neighborhood Indicators Alliance based out of the University of Baltimore along with the university’s College of Public Affairs and the University of Maryland National Center for Smart Growth and Communities without Boundaries International, developed a framework of 54 indicators. Published in 2016, the report, Baltimore’s Sustainable Future: Localizing the UN Sustainable Development Goals, Strategies and Indicators, was used to track Baltimore’s progress on the SDGs.
While the release of the annual GLI provides brief bragging rights for cities that have ranked above their peers, open, local data is the best way to encourage real progress. As the social, environmental and economic issues faced by cities increase in complexity, urgent, open data enables more transparent, measured and targeted decisions that can push new innovations and results that leave no one behind and have a lasting impact on citizens’ quality of life.
Don't miss any update on this topic
Create a free account and access your personalized content collection with our latest publications and analyses.
License and Republishing
World Economic Forum articles may be republished in accordance with the Creative Commons Attribution-NonCommercial-NoDerivatives 4.0 International Public License, and in accordance with our Terms of Use.
The views expressed in this article are those of the author alone and not the World Economic Forum.
Stay up to date:
Civic Participation

Forum Stories newsletter
Bringing you weekly curated insights and analysis on the global issues that matter.
More on Sustainable DevelopmentSee all

Naoko Tochibayashi
June 12, 2026


