Here are the ECB’s measures of underlying inflation for the euro area

the ECB generally monitors a range of measures of underlying inflation to help distinguish noise from signal in headline inflation. Image: REUTERS/Heinz-Peter Bader
Just like other central banks, the ECB generally monitors a range of measures of underlying inflation to help distinguish noise from signal in headline inflation. This column describes measures of underlying inflation that are routinely used at the ECB for measuring euro area headline inflation and provides some insights on their interpretation. Each of the measures has merits and shortcomings and they should be taken together in arriving at a first-pass assessment of developments in headline inflation. At the same time, the measures need to be complemented by a more structural examination of their driving forces in order to better understand the inflation process.
The ECB routinely monitors a wide range of measures of underlying inflation. Together with a broader set of macroeconomic information, these measures can provide intermediate milestones to assess medium-term inflationary pressure. The measures of underlying inflation are surrounded by uncertainty and no single measure has emerged as consistently superior in a recent empirical exercise (Ehrmann et al. 2018). This advises the use of a range of measures, a practice that is in line with that at major central banks globally. Still, as these measures can periodically provide conflicting signals, it is important to be able to interpret their individual movements. To this end, we describe the rationale and provide some insights on the interpretation of measures of underlying inflation that are regularly used at the ECB.
The measures which we analyse can be broken up into two broad categories.
First, there are purely statistical approaches that comprise permanent and temporary exclusion measures, whereby some items of headline inflation are excluded a priori on account of their volatility. Second, there are model-based measures including: (1) the Supercore measure, which is based on those items in the Harmonised Index of Consumer Prices (HICP) excluding food and energy that are deemed sensitive to the business cycle; and (2) the Persistent and Common Component of Inflation (PCCI) which exploits the cross-sectional variation of inflation components. Coinciding with the publication of this column, the model-based series are now available on a regular basis at the ECB’s Statistical Data Warehouse.1
We discuss in turn the statistical and model-based measures, which are summarised in Figure 1.
Figure 1 Measures of underlying inflation for the euro area (annual percentage changes)

Measures that permanently exclude certain items from a price index are part of the monitoring toolkit used by central banks around the world. Such measures abstract from volatility that can sometimes be attributable to temporary factors that have little relevance for inflation in the medium term. One of the measures often used at the ECB is the HICP inflation excluding energy and food (HICPX), which can help to abstract from the direct impact of large swings in oil prices and volatility in food commodity prices induced by unseasonal weather. Based on the weight of services (45%) and non-energy industrial goods (26%) in HICP, it reflects over 70% of the HICP – with energy accounting for about 10% and food accounting for another 20%. HICP excluding food and energy is usually the ‘anchor indicator’ considered for underlying inflation.
Another permanent exclusion inflation measure is HICPX excluding travel, and clothing and footwear items (this reduces the weight of this sub-index in HICP by around 10 percentage points to 60%). The aim of this measure is to show developments excluding the very volatile travel-related items (affected, for example, by calendar effects such as those arising from the different timing of Easter from one year to the next) and clothing (affected, for example, by sales periods), which can exhibit growth rates that can change quite substantially from one month to the next. For instance, during 2017, there were large but temporary divergences between this measure and HICPX, which were mainly attributable to the impact of volatile travel-related items. The advantage of such measures is that they are relatively easy to compute, interpret and communicate to the public. The implicit assumption is that minimising volatility will help to isolate the more persistent movements in inflation. A cross-check of volatility against some standard metrics of persistence generally supports the assumption that the excluded items (i.e. more volatile items) are also characterised by lower persistence (see Figure 2). This assumption tends to hold in particular for those items carrying a larger weight in the respective excluded sub-component. For example, the garments item has relatively high volatility and low persistence while also accounting for a large proportion of the clothing and footwear category. Similarly, air fares and package holidays have relatively high volatility and low persistence while together accounting for a large proportion of travel-related items.
Figure 2 Persistence and volatility of sub-components of inflation

Temporary exclusion measures are also fairly commonly used across central banks. Large price changes can occur in a given month, for instance, following strong fluctuations in commodity prices. Such outlying price changes may unduly influence the annual rate of HICP inflation. During these periods, trimmed means may give a better sense as to how broad-based movements in inflation are. The ECB uses a 10% trimmed mean, a 30% trimmed mean and a weight median – see the blue range in Figure 1. These measures offer more flexibility than the standard core measures as they can also abstract from large one-off price changes in items that are typically non-volatile. They are also easy to compute. However, they can be less amenable to interpretation as the set of excluded items can vary from one month to the next. Furthermore, the degree of trimming used is quite arbitrary and is fixed over time. A 10% trimmed mean may not always be sufficiently robust to outliers. For example, during periods when there are large swings in oil prices, the trimmed distribution of price changes tends to be still heavily skewed (see in 2015/2016 in Figure 3). During less volatile periods, a 30% trimmed mean may be too crude, possibly omitting rates of change that are relatively high or low but nonetheless persistent. Finally, by focusing on the cross-sectional distribution aspect of price changes to reduce volatility, it is not clear whether these indicators give an improved measure of medium-term inflationary pressure.
Figure 3 Distribution of the 93 annual HICP inflation rates

Standard permanent and temporary exclusion measures exclude items purely on the basis of statistical criteria. The Supercore measure is a model-based approach that goes further by establishing a macroeconomic link to domestic drivers of inflationary pressures. Previous approaches have selected those items where the slack coefficient in the respective basic Phillip’s curve is significant and of the correct sign (Fröhling and Lommatzsch 2011, ECB 2014). However, each of the large number of tests may suffer from omitted variable bias. To avoid this, the current ECB approach uses an out-of-sample forecast exercise to select the items for its Supercore measure – if the inclusion of the slack variable improves the forecast performance, then the item is deemed to respond to slack and is included (O’Brien 2018). Supercore tends to exclude items that are frequently affected by one-off changes or extremely volatility. In a similar exercise to Mahedy and Shapiro (2017), the main drivers of the ‘non-Supercore’ series (i.e. those items in the HICPX that are not included in the Supercore index) are identified for the euro area. Such items may at times provide some insights as to why inflation may not be responding to its main domestic driving factors such as slack or inflation expectations. These items include telecommunication services and administered items (such as social protection), which together may partly explain why HICPX inflation remained subdued during 2017 (see Figure 4).
Figure 4 Supercore and decomposition of non-Supercore

Each of the measures presented so far excludes a subset of HICP items entirely although each item may to varying degrees be driven by persistent as well as transitory shocks. In contrast, rather than working in the HICP item dimension, the PCCI measure of underlying inflation works directly in the frequency dimension. The PCCI can provide some insight into the role of common, low-frequency (i.e. trend) movements across all the 93 components of HICP inflation for 12 countries (Bobeica and Banbura forthcoming, Porqueddu 2018). The PCCI can be especially useful when several idiosyncratic shocks across countries and items also affect items that are normally not volatile.
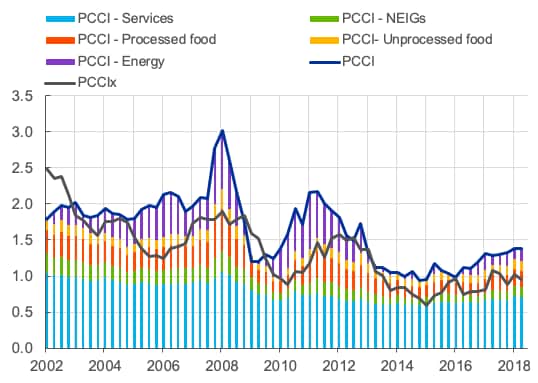
Technically, the PCCI belongs to the class of generalised dynamic factor models. In order to mitigate any potential impact and uncertainty arising from the arbitrary choice of the number of factors in the model, the final indicator uses an average of 81 estimates obtained for different combinations of dynamic (from two to eight) and static (from four to 16) factors. The statistical and model-average nature of the indicator does not allow for a straightforward structural interpretation of its determinants. Nevertheless, very speculatively, on the basis of a correlation analysis, one could infer that the first dynamic factor captures primarily domestic cost pressures, the second energy prices, and the third and fourth processed and unprocessed food price pressures, respectively. A simple decomposition of the PCCI into its subcomponents can also help to interpret its movements (see Figure 5). For example, the PCCI stood at 1.4% in July, 0.2 percentage points below its own historical average, signalling a slow but continuous recovery from its lowest level registered in January 2015. This is largely explained by increased contributions from the energy as well as, albeit to a smaller degree, the services and non-energy industrial goodssub-components of the PCCI.
The main advantage compared with exclusion-based measures, such as HICPX, is that the PCCI also includes the impact of medium-term shocks affecting food and energy, to the extent that they have common effects. At the same time, it excludes short-term fluctuations in prices that are considered as ‘core’ in the traditional exclusion measures (such as service prices).
Figure 5 The PCCI measure of underlying inflation
The ECB routinely monitors these measures of underlying inflation as well as, on a more ad-hoc basis, other measures that exclude for example indirect taxes and/or administered prices. On the practical side, these measures are generally available on a timely basis (i.e. about two weeks after the flash release at the latest). Also, the measures are generally not subject to large revisions. One notable exception is the Supercore, which can at times be impacted by large historical revisions to the output gap series. In a recent empirical exercise (Ehrmann at al. 2018), no single measure emerged as consistently superior to the other measures. In particular, the performance of the measures of underlying inflation in tracking the persistent component of headline inflation was found to be episodic. Notably, the predictive accuracy of the measures of underlying inflation varies strongly over time. This suggests a continuation of the practice of monitoring a range of measures, a practice that is common across central banks globally.
Summing up, the measures of underlying inflation used by the ECB offer different insights that together can be helpful in understanding developments in headline inflation. Empirical results suggest that no single measure of underlying inflation is superior in all situations suggesting that a full range of measures should continue to be monitored. Measures of underlying inflation are only a first pass at quantifying underlying inflationary pressure over the medium term. They need to be complemented by a more structural examination of their driving forces in order to better understand the inflation process.
Don't miss any update on this topic
Create a free account and access your personalized content collection with our latest publications and analyses.
License and Republishing
World Economic Forum articles may be republished in accordance with the Creative Commons Attribution-NonCommercial-NoDerivatives 4.0 International Public License, and in accordance with our Terms of Use.
The views expressed in this article are those of the author alone and not the World Economic Forum.
Stay up to date:
Inclusive Growth Framework

Forum Stories newsletter
Bringing you weekly curated insights and analysis on the global issues that matter.
More on Geographies in DepthSee all

Naoko Tochibayashi
October 30, 2025


