How a graph of temperature changes has turned into #ShowYourStripes

The effects of climate change are being felt across the world. Image: REUTERS/Rodrigo Garrido
It’s been said that a picture is worth a thousand words.
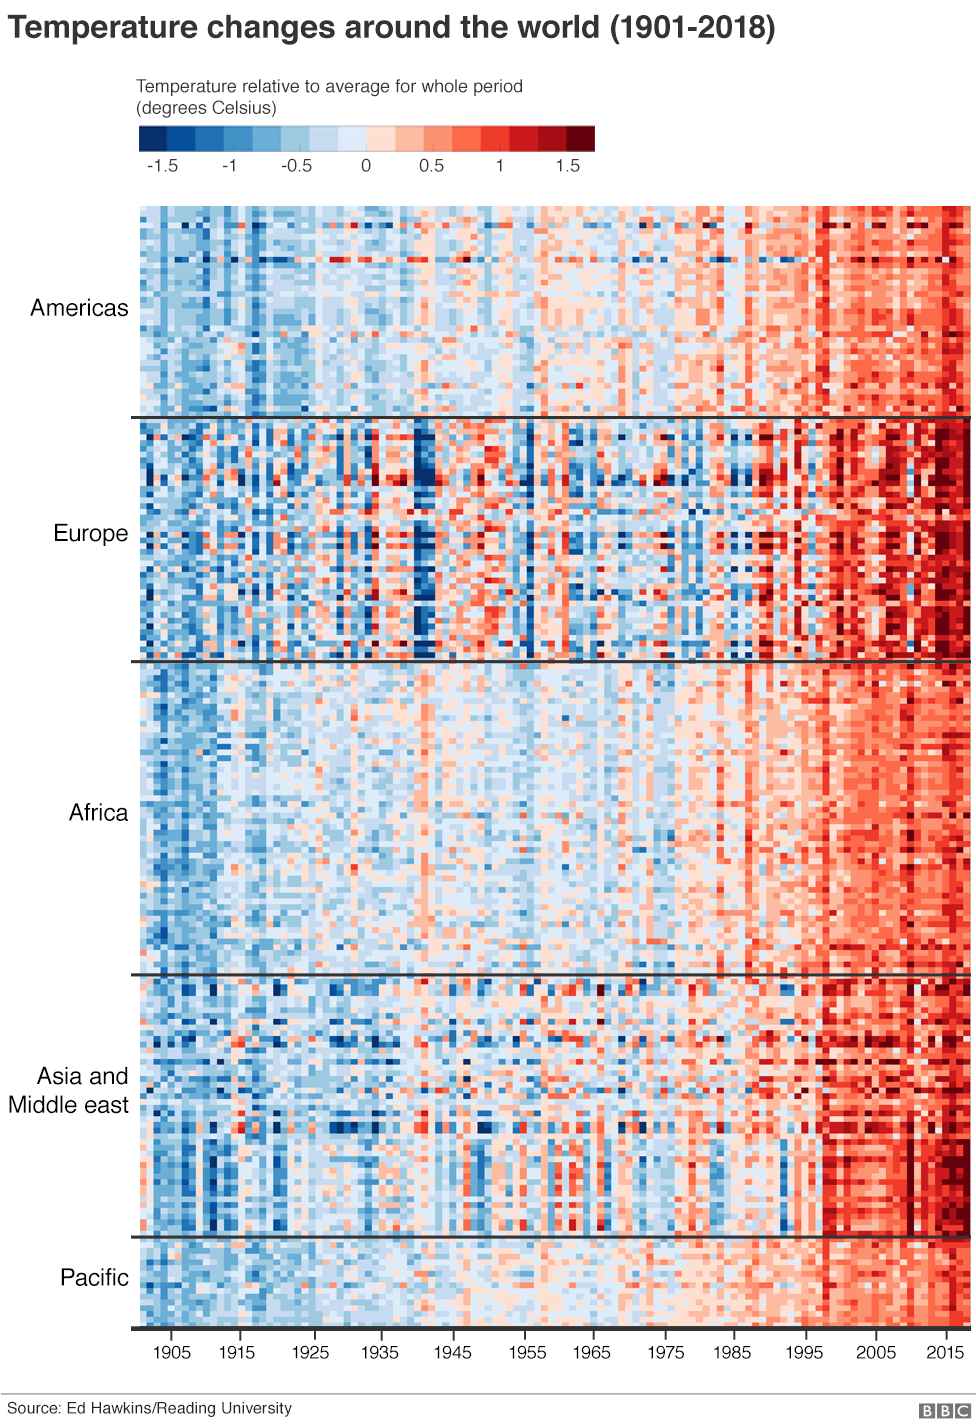
When Ed Hawkins, a professor of climate science at Reading University in the UK, wanted to find the simplest way to tell the story of global warming, he turned to an image.
His climate stripes graphic shows how average temperatures have risen over more than a century, going from dark blue to dark red. It paints a stark and unmistakable picture of how our planet is heating up.
The image has been made available as a download from Prof. Hawkins’ website. And it’s begun to take on a life of its own, appearing on T-shirts and other items of clothing, along with the hashtag #ShowYourStripes.
Someone even painted their Tesla electric car in the climate stripes pattern.
"What I've learnt from this is that you don't need the numbers to get the message across. The colours will do that," Prof. Hawkins told BBC News.
How is the World Economic Forum facilitating the transition to clean energy?
Join the Voice for the Planet movement
Don't miss any update on this topic
Create a free account and access your personalized content collection with our latest publications and analyses.
License and Republishing
World Economic Forum articles may be republished in accordance with the Creative Commons Attribution-NonCommercial-NoDerivatives 4.0 International Public License, and in accordance with our Terms of Use.
The views expressed in this article are those of the author alone and not the World Economic Forum.
Stay up to date:
Climate Crisis

Forum Stories newsletter
Bringing you weekly curated insights and analysis on the global issues that matter.
More on Climate Action and Waste Reduction See all

Planet in focus: The technologies helping restore balance – and other news to watch in frontier tech
Jeremy Jurgens
November 13, 2025


