Each for Equal is the women's day theme - these maps of the world show how far we have to go

Working women around the world face lingering inequality Image: REUTERS/Anindito Mukherjee (INDIA - Tags: BUSINESS POLITICS ELECTIONS EMPLOYMENT TEXTILE) - GM1EA550X2U01
-The World Economic Forum created a visualization of global gender inequality.
-Nagging gaps remain, including a pay gap as high as 34%.
-Female inclusion varies dramatically both among and within countries.
Seeing is believing.
The theme for International Women’s Day, celebrated on 8 March 2020, is “Each for Equal” – so the World Economic Forum created a visualization of some of the most glaring instances of lingering gender inequality around the world.
One of the most frequently cited disparities is the pay gap. Median earnings for women were 34% lower than for men in South Korea as of 2018, nearly 19% lower for women in Canada, and 14% lower for women in Mexico, according to the OECD. In the European Union, women were earning 16% on average less per hour than men as of 2017 – a figure that had hardly budged in a decade.
The world’s biggest economy is no exception. As recently as just a few years ago, according to US Census data, the gender pay gap in America was easily spotted. In the images below, coloured dots represent US income levels in 2016: blue means more than $100,000 per year, green is between $100,000 and $50,000, yellow is between $50,000 and $20,000, and red is less than $20,000. This first view shows incomes for men, featuring a healthy mix of green and yellow.
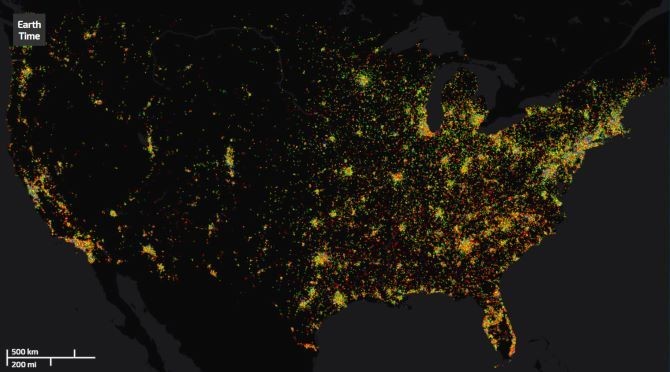
Now here are incomes for women that same year – featuring a lot of red.

How about in Silicon Valley, a vital economic engine located in the politically progressive San Francisco Bay Area? Again, the disparity as of just a few years ago is striking. This first view shows annual incomes for men, which are heavy on the blues and greens that represent higher pay levels.

Now here are annual incomes for women, which are heavy on the reds and yellows that represent lower pay levels.

It’s not just about pay.
The 2019 edition of the Women, Peace, and Security Index measured female social inclusion in 167 different countries – based on financial (are women able to have a bank account?), political (how many women get elected to parliament?), legal (are there discriminatory laws targeting women?), and other factors.
Below we see the top-ranked territories in the 2019 index coloured green, which then slips to yellow, orange, and finally red as index scores decrease.

The index reflected stark differences not just among countries, but also within countries. Nigeria, depicted below, had the greatest disparities between regions. Only some states in Africa’s most-populous nation have passed laws criminalizing child marriage, female genital mutilation and gender-based violence, according to the index – and northern states tend to be governed in part by Sharia penal codes that make marital rape legal.

Around the world, efforts are being made to close gender gaps in terms of economic opportunity, educational attainment, health and survival, and political empowerment. The World Economic Forum’s Global Gender Gap Report has tracked related progress over the years. Below we see improvement on a country-by-country basis from 2008 to 2018 reflected in colours, where blue denotes the most progress made in closing the gender gap (80% closed), followed by green, yellow, orange, and finally red (only 50% of the gap closed).
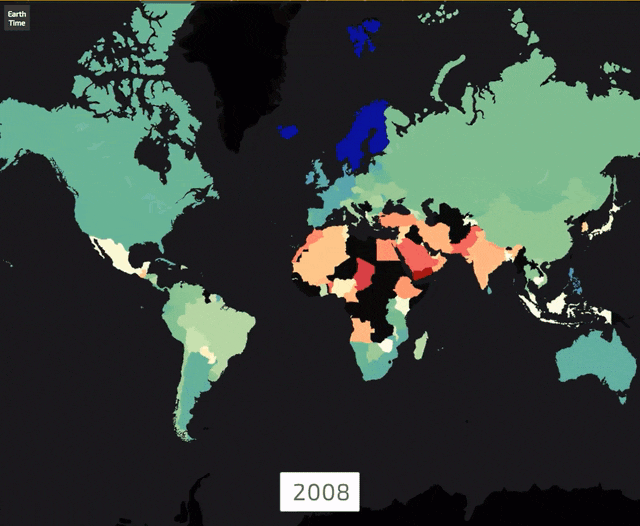
Clearly, there is still much work to be done. According to the 2020 edition of the Gender Gap Report, based on current trends the overall global gender gap will not be closed for nearly a century.
The World Economic Forum’s Strategic Intelligence platform contextualizes global issues, industries, and countries in an interactive tool. Many of the topics, including Gender Parity, feature data visualizations under the “data” tab. You'll need to register to view.

Don't miss any update on this topic
Create a free account and access your personalized content collection with our latest publications and analyses.
License and Republishing
World Economic Forum articles may be republished in accordance with the Creative Commons Attribution-NonCommercial-NoDerivatives 4.0 International Public License, and in accordance with our Terms of Use.
The views expressed in this article are those of the author alone and not the World Economic Forum.
Stay up to date:
SDG 05: Gender Equality

Forum Stories newsletter
Bringing you weekly curated insights and analysis on the global issues that matter.
More on Equity, Diversity and InclusionSee all

Addisu A Lashitew, Constance Dumalanède and Giacomo Ciambotti
April 1, 2026


