These 5 charts explore the human impact on extreme weather

It's not an exact science, but it's science: humans are partly to blame for worsening weather Image: REUTERS/Adrees Latif
Linking specific extreme weather events to global warming is difficult, and this plays into the hands of climate-change deniers.
In the past couple of weeks, tropical storms have devastated communities around the world. Hurricane Harvey has wreaked havoc in Texas, destroying homes and claiming lives. Typhoon Hato has left a similar trail of destruction in southern China and Hong Kong.
There is a strong argument to be made that humans are at least partly responsible for both of these extreme weather events. The problem is it’s often difficult to produce tangible evidence.
What we do know for sure, however, is that climate change enhances storm surges and causes flooding – both of which can have devastating consequences.

Spike in carbon emissions
This chart, which was produced by NASA, shows the level of atmospheric carbon dioxide – or C02, to give it its chemical formula – over the past 400,000 years.
As human activity gathered momentum in the mid 20th century – in the form of growing populations and the rise of heavy industry – carbon emissions also followed an upward trajectory.
The heat-trapping nature of carbon dioxide has created a warming effect. This has coincided with an uptick in the number and scale of natural disasters such as droughts, floods, wildfires and storms.

These countries produce the most C02
It will come as no surprise to learn that China and the United States are the most prolific carbon emitters. Both countries are among those with the biggest populations, the most factories and the highest number of cars.

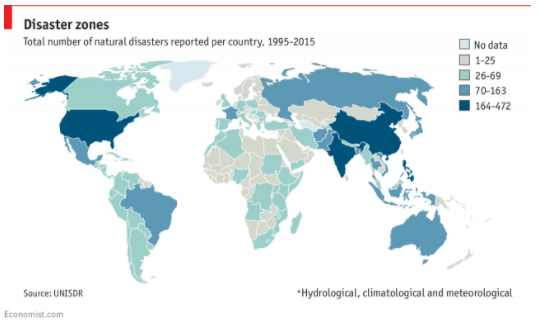
The same countries suffer the most natural disasters
Interestingly, it is those same countries that top the table in terms of carbon emissions that have experienced the highest number of hydrological, meteorological and climatological disasters in recent years.
According to the United Nations Office for Disaster Risk Reduction (UNISDR), China, the US and India were among the countries worst hit by extreme weather events from 1995 to 2015.
Large parts of Africa and Europe have so far been relatively unscathed by the onslaught of these types of natural disasters.
More floods than ever before
As the atmosphere gets warmer it absorbs more moisture – this works out at roughly 7% more for every 1℃ rise in temperature. The end result is worse flooding.
Higher sea levels in turn lead to bigger storm surges, such as those that have caused devastation in Texas and southern China.
It’s no coincidence that an increase in carbon emissions coincides with a steady rise in the number of hydrological disasters over recent years.

The cost of catastrophe
It has been estimated previously that flooding could cost coastal cities around $1 trillion per year by the year 2050.
Yet again, it is towns and cities in the US and China that are expected to bear the brunt.

Don't miss any update on this topic
Create a free account and access your personalized content collection with our latest publications and analyses.
License and Republishing
World Economic Forum articles may be republished in accordance with the Creative Commons Attribution-NonCommercial-NoDerivatives 4.0 International Public License, and in accordance with our Terms of Use.
The views expressed in this article are those of the author alone and not the World Economic Forum.
Stay up to date:
Climate Crisis
Related topics:

Forum Stories newsletter
Bringing you weekly curated insights and analysis on the global issues that matter.
More on Climate Action and Waste Reduction See all

Shinnosuke Komiya and Chitresh Saraswat
July 3, 2026


