From data to action: This tool will help you navigate the future of jobs

The Future of Jobs Report 2025 Data Explorer transforms complex workforce data into accessible, visual insights. Image: Getty Images/iStockphoto
- The future of work is rapidly evolving, driven by technological change and global transitions, such as artificial intelligence and climate change.
- The Future of Jobs Report 2025 Data Explorer transforms complex workforce data into accessible, visual insights tailored for decision-makers across policy, business and research.
- The tool is designed for practical use, enabling users to explore trends, compare regions and industries, and identify critical shifts in job demand and skills.
How are AI and robotics reshaping the skills we need? Where will the green transition create new jobs and where might it displace them?
These questions have become more urgent as technology reshapes industries and global challenges upend traditional career paths. Policy-makers, business leaders and researchers are now all searching for reliable ways to navigate the future of work.
The Future of Jobs Report 2025 Data Explorer can help answer these questions as an interactive tool that turns copious workforce data into clear, actionable insights.
It is built on the latest findings from the World Economic Forum’s Future of Jobs Report 2025. It allows users to delve into evolving job markets, shifting skills demands and transformative global trends.
From shaping education systems or planning workforce strategies to analyzing labour market shifts, the tool allows visualization and comparison of how jobs and skills are changing across industries and regions.
The dashboard presents four ways to explore the data, demonstrating the changing landscape of jobs, skills and workforce practices across industries and regions. Here’s a breakdown of how you can utilize each view.
Have you read?
Alluvial view: Tracking job and skill evolution
The alluvial view illustrates how macro trends and technology shifts are expected to impact jobs and skills through flowing, connected visualizations.
- Choose between “Trend Impact on Jobs” or “Trend Impact on Skills” from the menu.
- Select a specific trend, e.g. “AI and information processing technologies” or “ageing and declining working-age populations” to see how it influences the growth or decline in each job or skill demand by 2030.
- Alternatively, select a specific job title to visualize which trends drive its projected growth or decline.
For instance, if you select “Broadening digital access” as a trend, you might discover it is linked to declining demand for roles such as administrative assistants, cashiers and material-recording clerks. Meanwhile, it increases the demand for software developers and university and higher education teachers.
The density of the connecting flows indicates the strength of the relationship.

Map view: Geographic perspectives
The map view provides a powerful visualization of how future of work indicators vary across countries and regions at a glance.
- Select any indicator from the drop-down menu (such as “Workforce strategies” – “Accelerate the automation of processes and tasks” or “Core skills in 2025 – Analytical thinking”).
- The map automatically displays colour-coded economies based on data values.
- Use the legend to interpret colour intensity.
As an example, if you select “Talent outlook – Talent availability when hiring – expected to improve,” you might notice that companies headquartered in the Middle East and Northern Africa are more optimistic about talent availability by 2030 compared to their European counterparts.
Pro-tip: click on any country to see a pop-up with exact values and benchmarks against global or regional averages. Use the “Compare with” drop-down menu on the left-hand panel to set global or regional comparisons. You can also click on a specific economy to access its economic profile.

Column view: Ranking and comparing
The column view allows you to compare and rank economies or industries across any indicator in the report.
- Select between “Economies” and “Industries” from the “Category” drop-down menu to scope the comparison.
- Select the indicator you want to explore from the drop-down menu.
- Choose your comparison entities in the “Compare with” menu.
Try selecting “Transformation barriers – Inability to attract talent to the industry”; you’ll notice the Real Estate sector stands out as the industry that views it as the key obstacle.
You can use the “Filter by” feature to filter results by region or income group for more nuanced analysis.
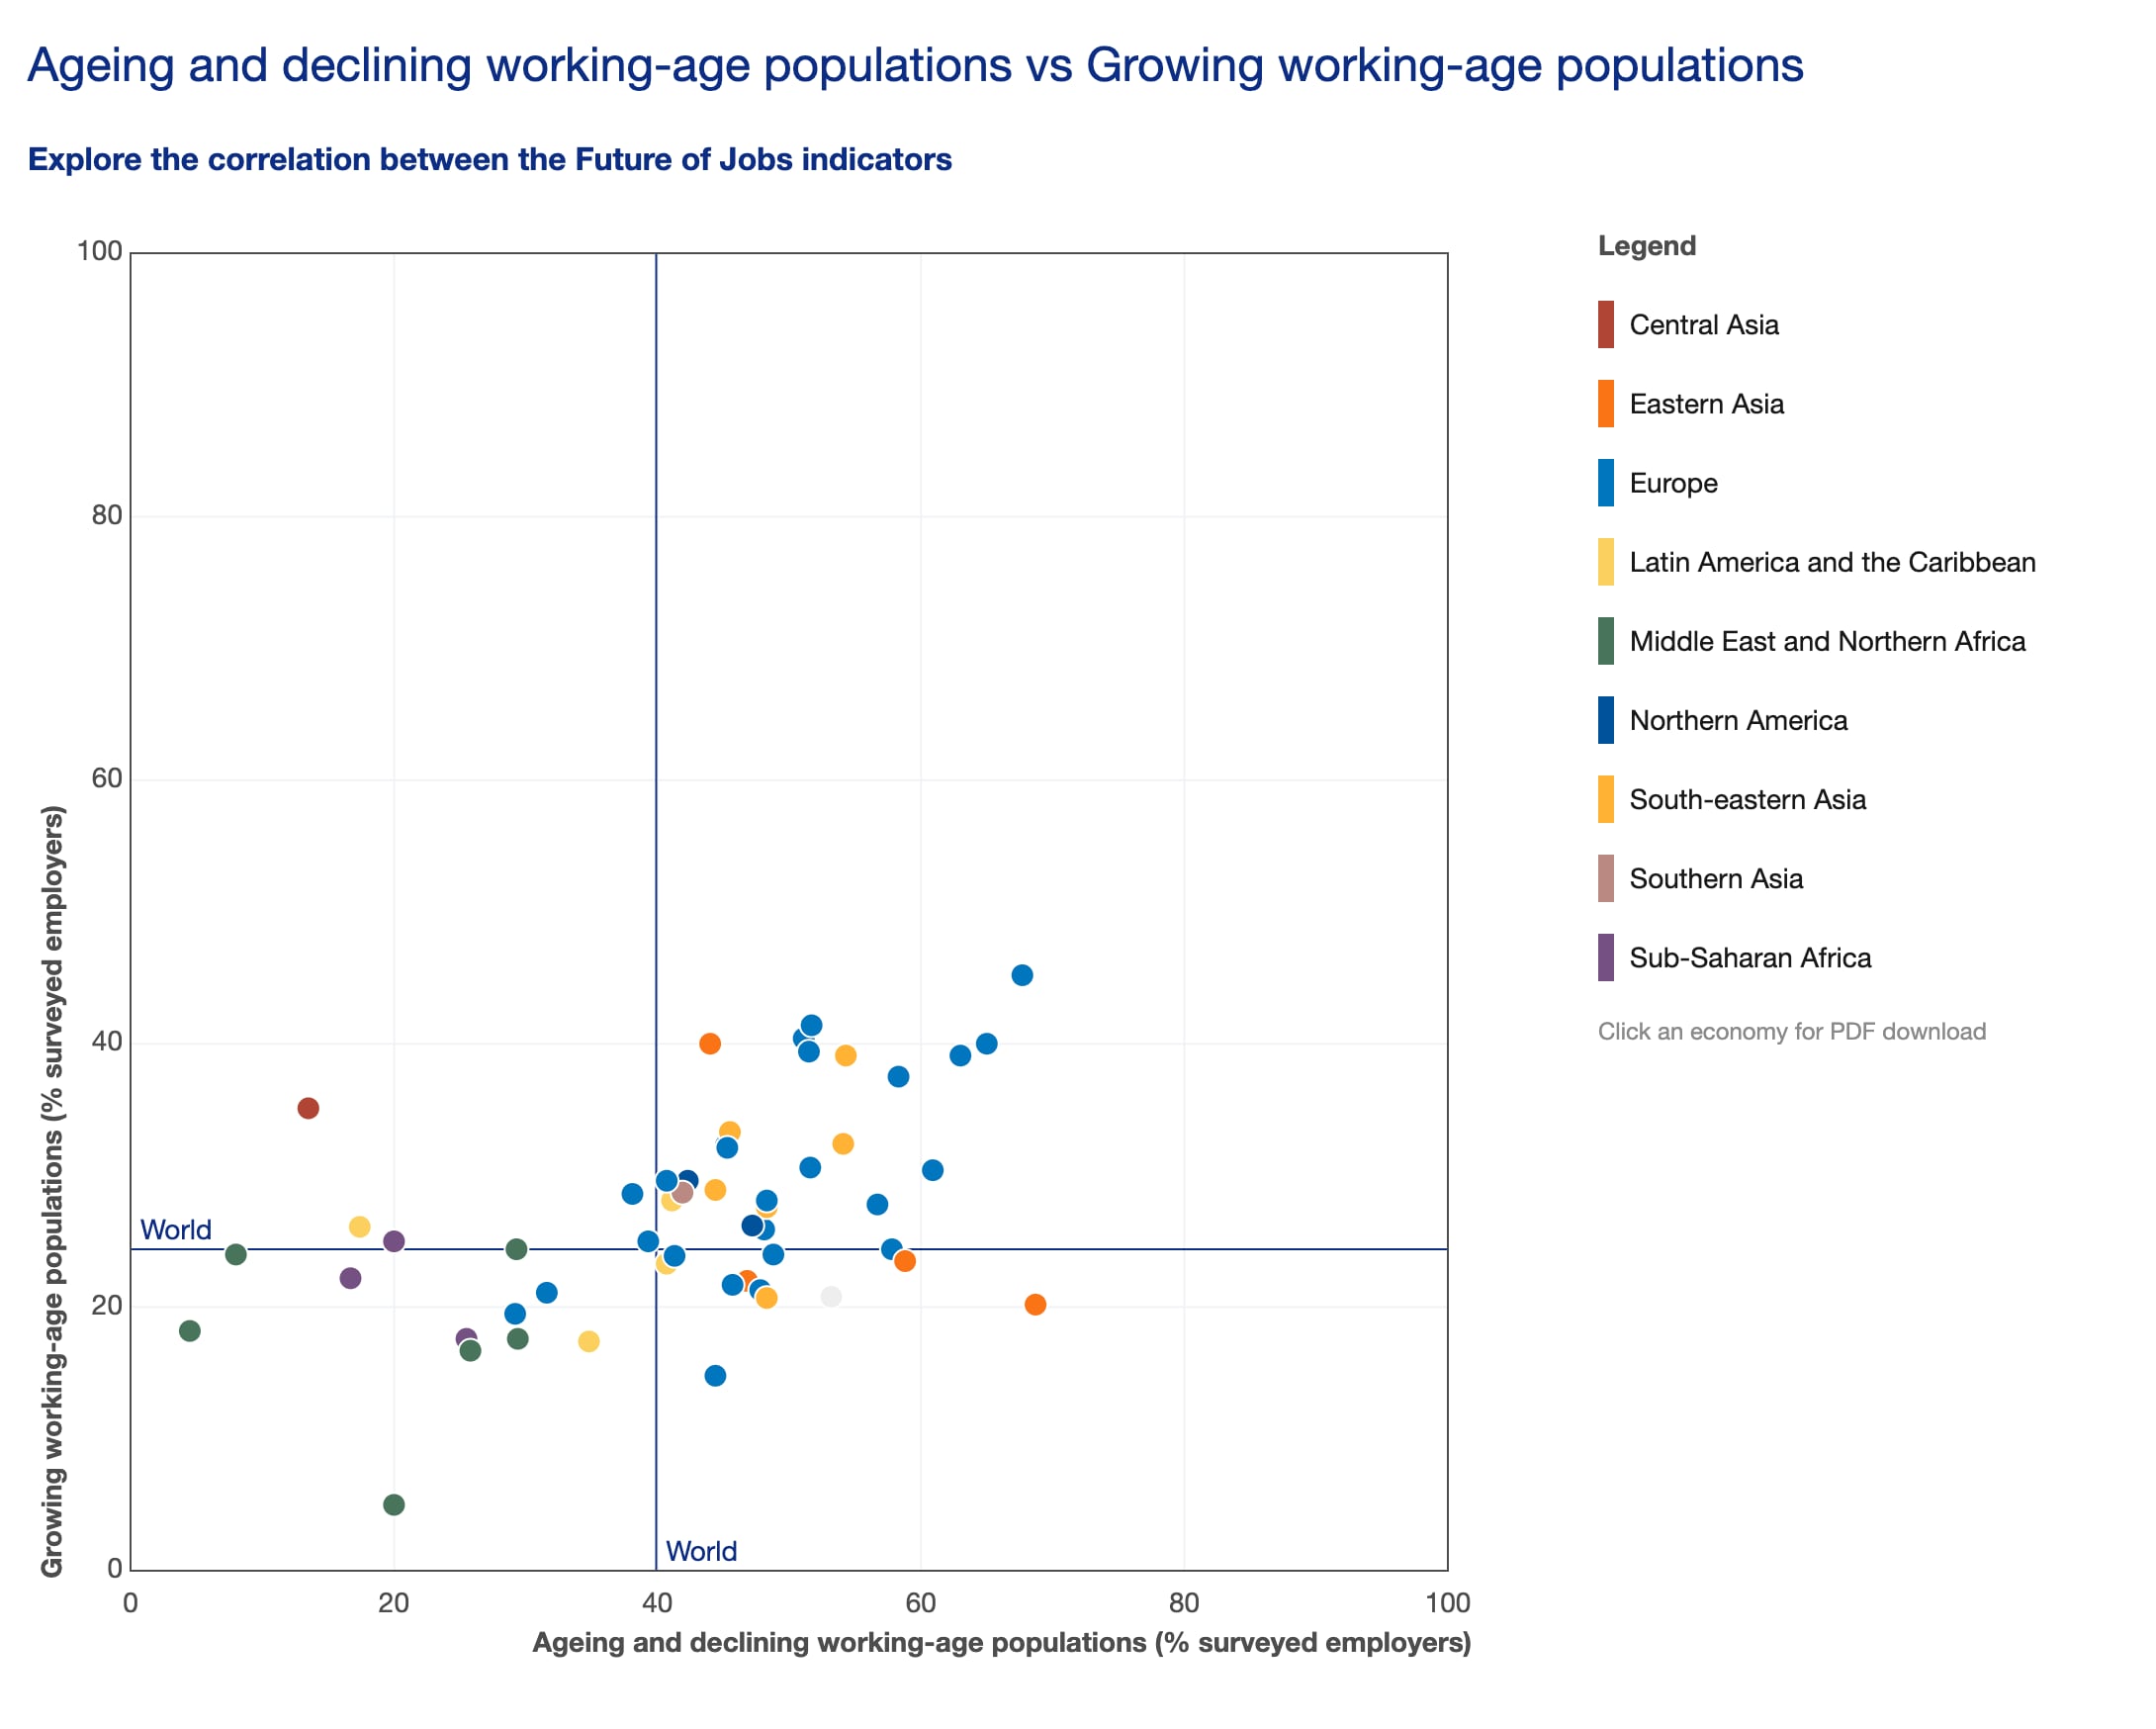
Scatter plot view: Exploring relationships
The scatter plot view helps uncover correlations between any two indicators in the report.
- Select an indicator for the X-axis.
- Select a different indicator for the Y-axis.
- Each dot represents an economy or industry, depending on your selection from the “Category” drop-down menu.
Plotting “Macrotrends – Increased efforts and investments to adapt to climate change” against “Technology trends – Energy generation, storage and distribution” might reveal that economies concerned about climate-adaptation trends also view energy technology as transformative. You might discover interesting outliers or unexpected patterns.
The quadrant lines feature also divides the plot into four sections based on global averages, helping identify leaders, laggards and interesting cases that excel in one dimension but not another.
Making the Future of Jobs data work for you
The Future of Jobs Report 2025 data explorer transforms complex workforce data into an accessible, interactive experience. Switching between views allows you to track how specific trends impact jobs and skills, identify economy- and region-level patterns and outliers, benchmark performance across economies and industries, and discover unexpected relationships between workforce indicators.
Whether designing policy, planning hiring strategies or researching labour market dynamics, this tool empowers you to extract the insights you need from the Future of Jobs Report 2025.
Don't miss any update on this topic
Create a free account and access your personalized content collection with our latest publications and analyses.
License and Republishing
World Economic Forum articles may be republished in accordance with the Creative Commons Attribution-NonCommercial-NoDerivatives 4.0 International Public License, and in accordance with our Terms of Use.
The views expressed in this article are those of the author alone and not the World Economic Forum.
Stay up to date:
The Digital Economy
Related topics:

Forum Stories newsletter
Bringing you weekly curated insights and analysis on the global issues that matter.
More on Education and SkillsSee all

Shivam Parashar
March 4, 2026


