Yes, we still need to measure the global gender gap — here’s why

The Global Gender Gap Report is world's longest-standing benchmarking index measuring the state of gender parity. Image: Getty Images/iStockphoto
- The Global Gender Gap Report 2025 is the 19th edition of the world's longest-standing benchmarking index measuring the state of gender parity across four dimensions.
- Iceland tops the index for the 16th consecutive year, while two other Nordic economies complete the top three.
- Policymakers, business leaders and NGOs all use the report to benchmark progress and advocate for change.
- Here are answers to some of the most frequently asked questions about the report.
Since 2006, the World Economic Forum has been measuring gender parity across the globe and publishing its findings in the annual Global Gender Gap Report.
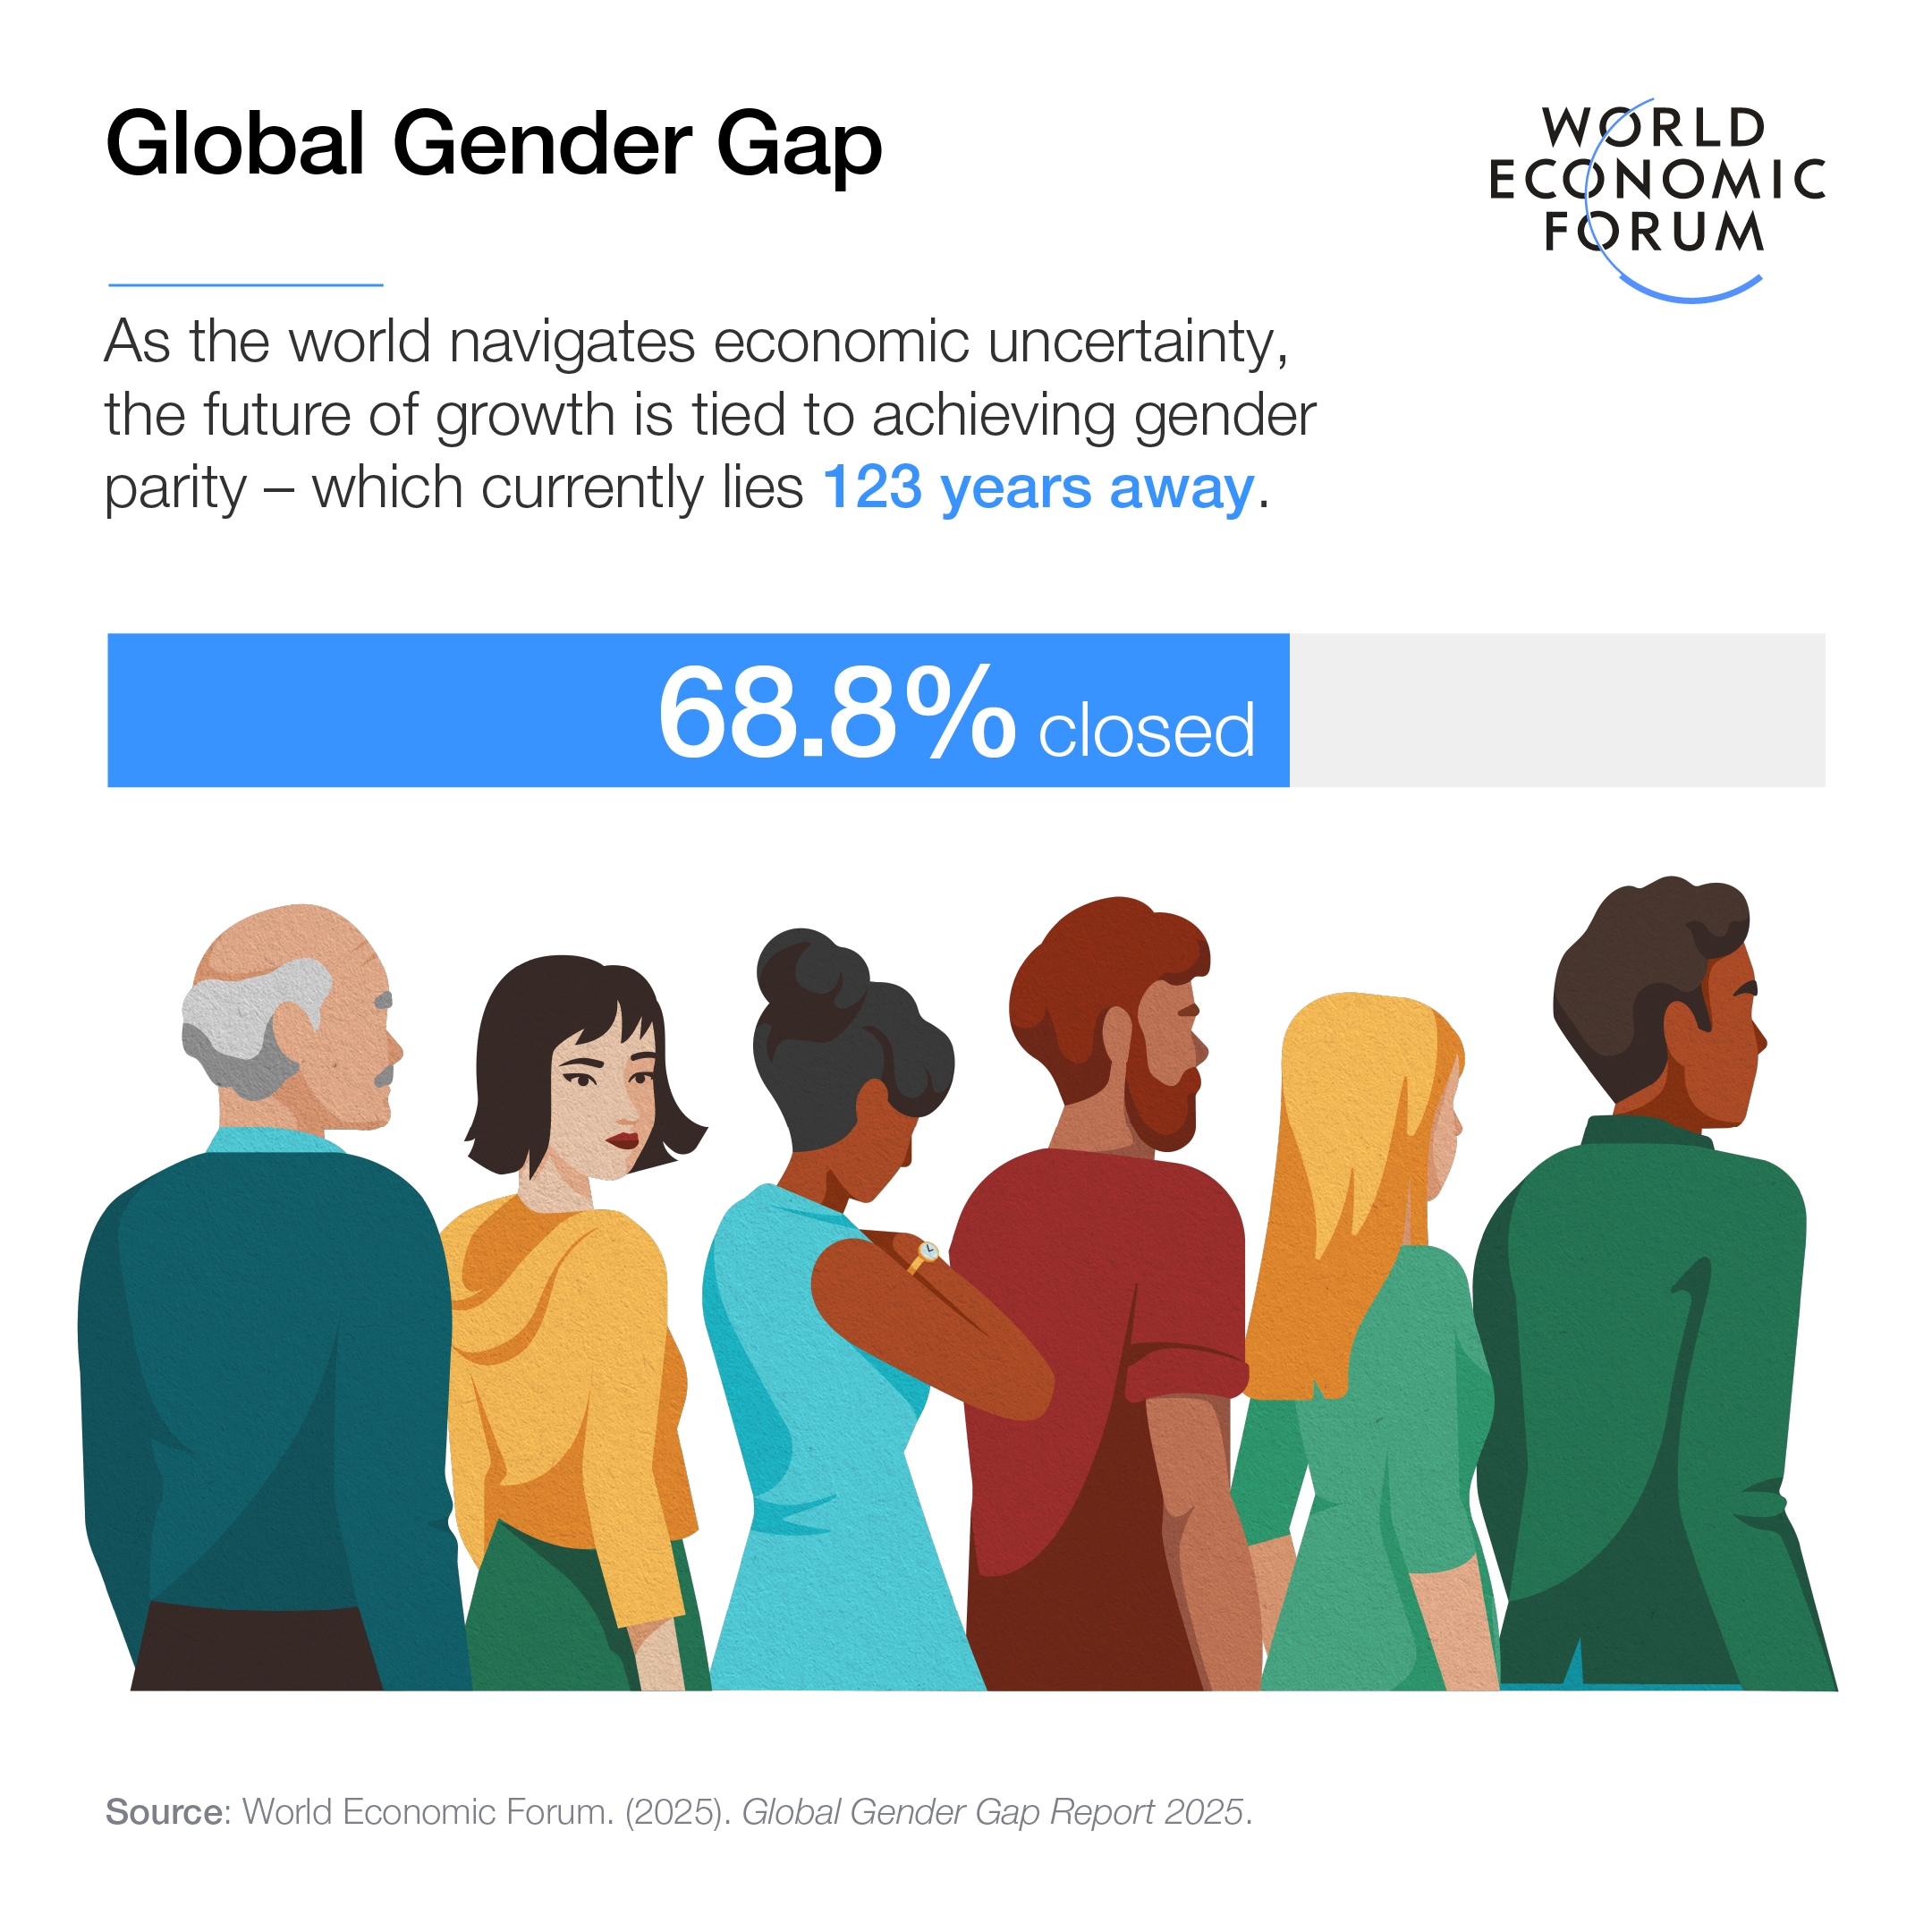
Two decades on, there has been progress towards closing the gap, but there is still more than 30% left to close, according to the 2025 edition – and it will take another 123 years before this happens, at the current pace.
What is the Global Gender Gap Report?
It was developed in 2005 in response to decades of growing international recognition of the need to achieve gender equality across economics, politics, education and health.
Building on milestones such as the establishment of UNIFEM in 1984 (now UN Women) and the landmark 1995 Beijing World Conference on Women, which introduced gender equality as a global mandate, the report emerged as a practical tool to assess and benchmark progress.
It aims to support the efforts of national, regional, and global stakeholders in closing gender gaps worldwide. In 2015, the United Nations made Gender Equality one of its 17 Sustainable Development Goals to achieve by 2030.
The Global Gender Gap Index annually benchmarks the state and evolution of gender parity across four key dimensions:
- Economic Participation and Opportunity
- Educational Attainment
- Health and Survival
- Political Empowerment
It is the longest-standing index tracking the progress of individual and collective efforts towards closing these gaps over time.
Why do we need to measure the gap?
As the saying goes, 'you can't manage what you can't measure'.
The report tracks access and opportunity needed to achieve full economic potential, serving as a benchmarking tool guiding policy and business action.
Measuring the global gender gap is essential because no economy, regardless of its level of development, has achieved full gender parity. Persistent disparities in education, health, economic opportunity and political spheres continue to limit global economic potential.
But empowering women benefits everyone – and there is mounting evidence from institutions including the International Monetary Fund (IMF) and the OECD that gender equality and economic growth go hand in hand.
How is the 'time to parity' metric calculated?
Throughout its past 19 editions, the index has intended to offer a stable metric to assess changes in gender parity indicators over time.
Using the methodology introduced in 2006, the index and the analysis focus on benchmarking parity between women and men at global, regional and economy levels based on the latest available data.
The level of progress toward gender parity (the parity score) for each indicator is calculated as the ratio of the value of each indicator for women to the value for men. A parity score of 1 indicates full parity. The gender gap is the distance from full parity.
The “time to parity” metric estimates the rate of progress to date (gender gap closed to date since the first edition in 2006, over the number of years). It then uses that rate of progress to calculate how many years it will take to close the remainder of the gap.
In this 19th edition, that time is 123 years.
Why do Iceland and other Nordic economies always come top?
Iceland has held the top spot for 16 years. Along with Finland, Denmark, Norway and Sweden, it is usually grouped with the so-called “Nordic economies” on account of similarities held across economic and political systems.
Throughout the 19 editions of the report, these economies have placed among the top 10 in every edition – except for Denmark.
However, the individual trajectories of these economies have significantly differed over time. While Iceland has added 14.4 percentage points to its score over 19 editions, Sweden has barely moved forward at all.
Iceland is the only one among the 148 economies covered in 2025 edition that has closed more than 90% of its gender gap.
All economies in this group had over 75% of their economic gap in 2025 edition, with Sweden and Finland surpassing 80%.
Over the past 19 editions, Finland has improved labour force participation parity the most, by 5.4 percentage points. While Sweden has increased the parity for legislators, senior officials and managers the most, by 34.5 percentage points over the same period.
All economies have seen their Health and Survival parity scores decrease over time.
Iceland has doubled its political parity score in under two decades, while Sweden has seen it decrease from 55% to 48.8%. While all economies in this group have had a female head of state in the past 50 years, only Iceland has reached parity in this indicator.
What is the relationship between gender parity scores and index rankings?
The index measures gender parity as a relative measure of access between men and women to resources and opportunities across the four sub-index dimensions.
The index is designed to measure gender-based gaps in access to resources and opportunities in economies, rather than the actual levels of the available resources and opportunities in those economies (including income levels).
If men and women experience equally positive or negative access conditions, the gender parity score will reflect that – and remain high.
Rankings on the other hand reflect an economy’s relative performance in comparison to all others included in a given edition. A single economy may have modestly improved their year-on-year gender parity scores yet still rank lower than an economy that made a more substantive score improvement.
What's the difference between parity and empowerment?
In measuring how women fare in relation to men, the report assesses the extent to which outcomes are equitable – and the gender gap score avoids rewarding or penalizing situations where women outperform men.
In contrast, metrics relating to women’s empowerment tend to assess the extent to which women have agency, ability and capacity to achieve outcomes – independently of men.
How is the report used by governments and business?
The report functions as a comprehensive resource providing baseline insights that may inform policy decisions and corporate strategies, all aimed at closing gender gaps and fostering inclusive and resilient growth worldwide.
- Policymakers use the report to benchmark their country's progress in closing gender gaps relative to other economies. Economy profiles offer governments an overview of areas where policy intervention could be needed, as well as an assessment of their progress over time. The report's insights can inform the development and implementation of targeted policies aimed at promoting gender equality.
- Businesses use the report to understand what gender disparities are present in their operating environments – across industries and geographies – as well as how they can collaborate with other decision-makers to reduce them. This awareness drives the adoption of gender parity initiatives to advance business strategy, enhance innovation, improve decision-making, and tap into a broader talent pool, ultimately contributing to better financial performance.
Spurred on by the insights featured in the report, the Forum invites government, business and civil society leaders to join the Global Gender Parity Sprint 2030 in this effort to reset the trendline to parity.
With a focus on fostering economic transformation, innovation and sustainable growth, key objectives revolve around reshaping labour markets, enhancing industry-level systems and integrating gender parity into the heart of global transformations in technology, climate action and care.
Why does the report include some indicators but not others?
The methodology of the report has remained largely stable since 2006. To ensure a global representation of the gender gap, the report aims to cover as many economies as possible. For an economy to be included, it must report data for a minimum 12 of the 14 indicators that comprise the index. The index includes the latest data available, where possible, reported within the past 10 years.
The index assesses the state of global gender parity based on outcomes rather than inputs or means. This approach is underpinned by an understanding that gender parity can be achieved by economies in different contexts and conditions.
Input and means indicators measure the resources, efforts or policies put in place to drive change – such as laws, budgets, programmes or institutional support. They reflect what an economy is doing to promote gender parity. Examples include the existence of maternity leave policies or equal pay legislation. These types of factors are not included in the index but are discussed further in the analytic sections and featured in the report’s Economy Profiles.
Output indicators measure the results or outcomes of those efforts – showing how men and women are faring in reality. This includes data like the percentage of women in leadership roles or the gender gap in literacy rates.
This approach is distinct to the index and continues to provide a sturdy basis for discussing underlying and contributing factors to outcomes.
Why does the report only measure gaps between men and women?
Since the report was launched, the availability and depth of disaggregated demographic data has evolved significantly and positively.
As the first and longest-standing benchmarking tool focusing on gender issues, the Global Gender Gap Report has focused on measuring gaps between men and women to provide the most essential, comprehensive, comparable and consistent global snapshot on the state of gender parity through time.
While other demographic dimensions of disparity bear further analysis, measuring disparities between women and men remains a crucial starting point in the long-term effort to realise inclusive growth.
License and Republishing
World Economic Forum articles may be republished in accordance with the Creative Commons Attribution-NonCommercial-NoDerivatives 4.0 International Public License, and in accordance with our Terms of Use.
The views expressed in this article are those of the author alone and not the World Economic Forum.
Contents
What is the Global Gender Gap Report? Why do we need to measure the gap?How is the 'time to parity' metric calculated?Why do Iceland and other Nordic economies always come top?What is the relationship between gender parity scores and index rankings?What's the difference between parity and empowerment?How is the report used by governments and business?Why does the report include some indicators but not others?Why does the report only measure gaps between men and women?Forum Stories newsletter
Bringing you weekly curated insights and analysis on the global issues that matter.
More on Equity, Diversity and InclusionSee all
Elizabeth Mills and Gayle Markovitz
January 30, 2026


