Satellites are giving us a totally new view of Earth’s carbon cycle

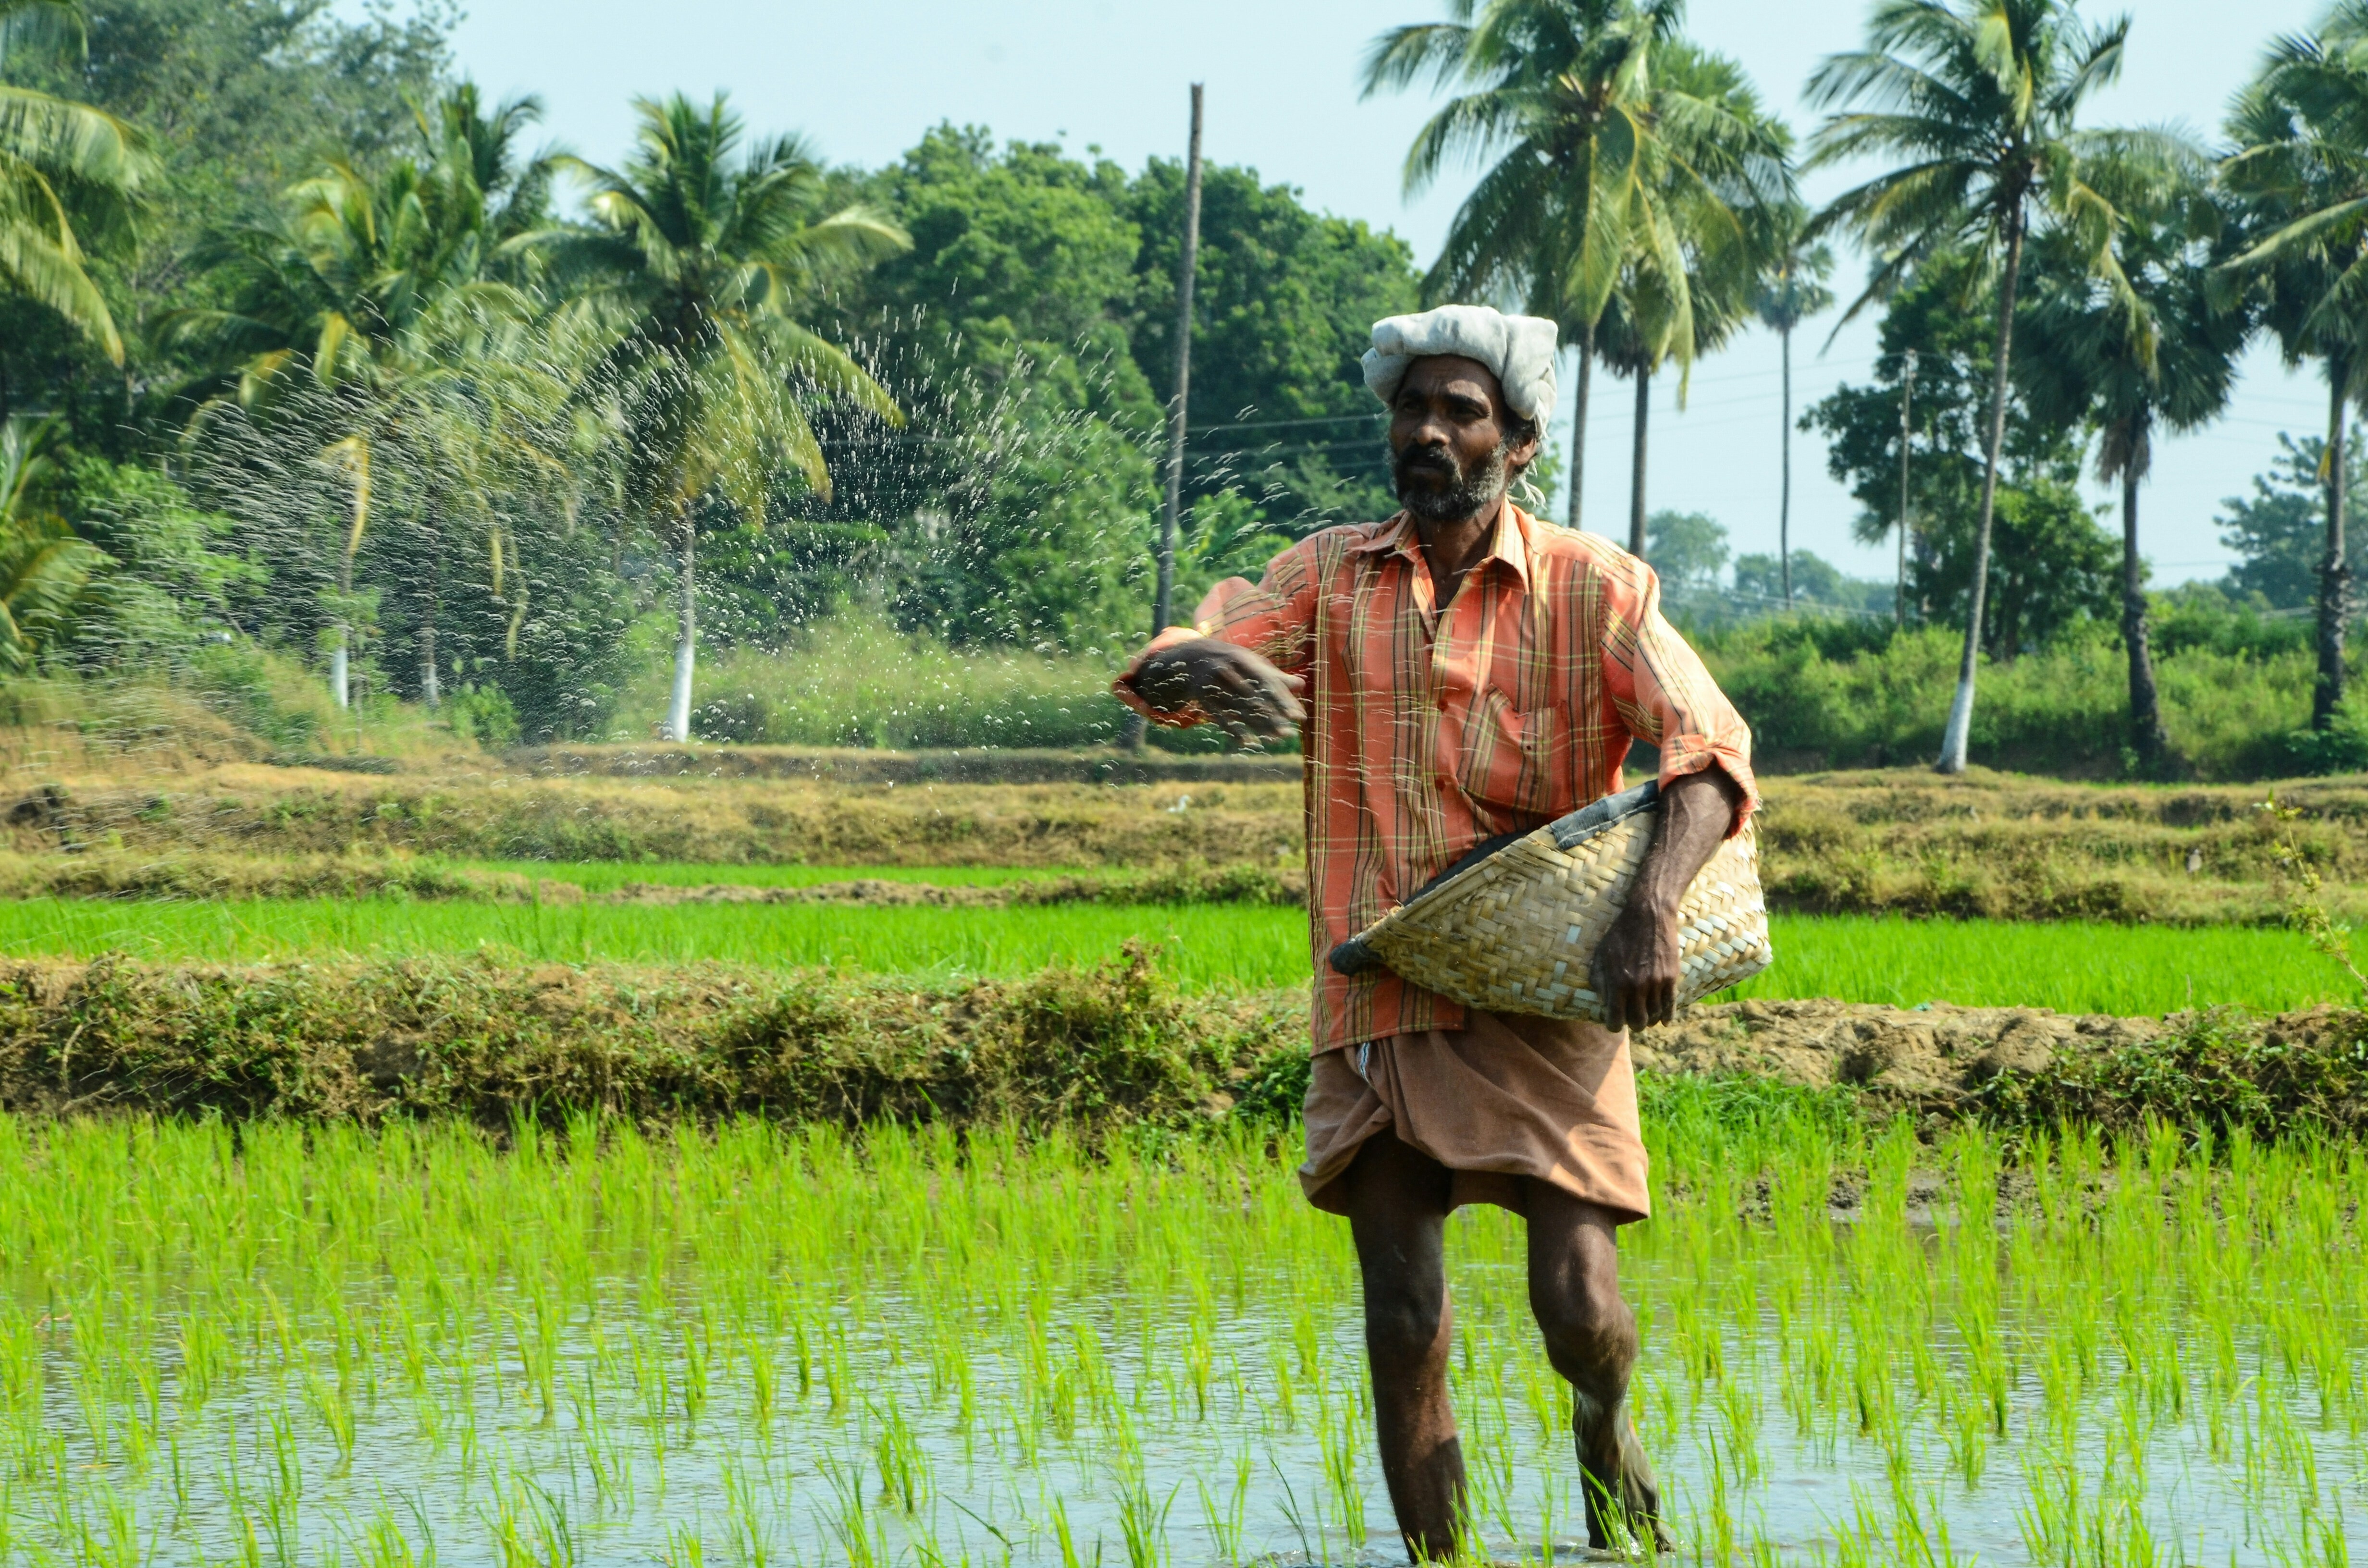
By using satellite technology we will be able to keep a better track on our carbon emissions. Image: REUTERS/NASA
The job of monitoring Earth’s carbon cycle and humanity’s carbon dioxide emissions is increasingly supported from above, thanks to the terabytes of data pouring down to Earth from satellites.
Five papers published in Science today provide data from NASA’s Orbiting Carbon Observatory-2 (OCO-2) mission. They show Earth’s carbon cycle in unprecedented detail, including the effects of fires in Southeast Asia, the growth rates of Amazonian forests, and the record-breaking rise in atmospheric carbon dioxide during the 2015-16 El Niño.
Another satellite study released two weeks ago revealed rapid biomass loss across the tropics, showing that we have been overlooking the largest sources of terrestrial carbon emissions. While we may worry about land clearing, twice as much biomass is being lost from tropical forests through degradation processes such as harvesting.
The next step in our understanding of Earth’s carbon dynamics will be to build sensors, satellites and computer models that can distinguish human activity from natural processes.
Can satellites see human-made emissions?
The idea of using satellites to keep track of our efforts to reduce fossil fuel emissions is enticing. Current satellites can’t do it, but the next generation is aiming to support the monitoring at the level of countries, regions and cities.
Current satellite sensors can measure CO₂ levels in the atmosphere, but can’t tell whether it is coming from the natural exchange of carbon with the land and oceans, or from human activities such as fossil fuel burning, cement production, and deforestation.
Likewise, satellites cannot distinguish between natural and human changes in leaf area cover (greenness), or the capacity of vegetation to absorb CO₂.
But as the spatial resolution of satellites increases, this will change. OCO-2 can see features as small as 3 square km while the previous purpose-built satellite GOSAT is limited to observing features no smaller than about 50 square km.
As resolution improves, we will be able to better observed the elevated CO₂ concentrations over emissions hotspots such as large cities, bushfire regions in Africa and Australia, or even individual power plants and industrial leaks.
By combining these sensing techniques with computer models of the atmosphere, oceans and land, we will be able to separate out humanity’s impact from natural processes.
For example, we have long known that atmospheric CO₂ concentration rises faster during an El Nino event, and that this is mainly due to changes on land. It was only with the bird’s-eye view afforded by the OCO-2 satellite could we see that each of the tropical continents reacted so differently during the recent big El Niño: fire emissions increased in Southeast Asia, carbon uptake by forests in Amazonia declined, and soil respiration in tropical Africa increased.
Similarly, we can now examine the processes behind the extraordinary greening of the Earth over recent decades as CO₂ levels have climbed. Up to 50% of vegetated land is now greener than it was 30 years ago. The increasing human-driven CO2 fertilization effect on vegetation was estimated to be the dominant driver.
We now have satellites that can study this process at spatial resolutions of tens of metres – meaning we can also keep tabs on processes that undo this greening, such as deforestation.
What’s in store
The coming decade will see the development of yet more space sensors and modelling tools to help us keep tabs on the carbon cycle.
GOSAT-2 will replace the current GOSAT, offering significantly improved resolution and more sensitive measurements of CO₂ and methane (CH₄), another important greenhouse gas.
Meanwhile, the GeoCarb satellite will be launched into a stationary orbit over the Americas to measure CO₂, CH₄ (largely from wetlands in the tropics), and carbon monoxide (from biomass burning). It will keep an eye out for any large leaks from the gas industry.
The BIOMASS and FLEX satellite missions will provide better global estimates of forest height and carbon density, and of plants’ photosynthetic capacity, respectively.
Aboard the International Space Station, an instrument called GEDI, will also estimate vegetation height and structure, and combined with ECOSTRESS will assess changes in above-ground biomass, carbon stocks and productivity.
In Australia, we are developing an atmospheric modelling system and a dynamic vegetation model able to ingest the latest generation of satellite and ground-base observations to map carbon sources and sinks over the entire continent.
Through the Terrestrial Ecosystem Research Network (TERN), we are preparing to take full advantage of these new missions, and help validate many of these space-borne estimates at TERN’s Supersites and other key sampling plots.
With the wealth of information set to be generated by space sensors, as well as earth-based observations and computer models, we are moving into an era when we will have an unprecedented ability to track humans’ impact on our atmosphere, lands and oceans.
Don't miss any update on this topic
Create a free account and access your personalized content collection with our latest publications and analyses.
License and Republishing
World Economic Forum articles may be republished in accordance with the Creative Commons Attribution-NonCommercial-NoDerivatives 4.0 International Public License, and in accordance with our Terms of Use.
The views expressed in this article are those of the author alone and not the World Economic Forum.
Stay up to date:
Space
Forum Stories newsletter
Bringing you weekly curated insights and analysis on the global issues that matter.
More on Nature and BiodiversitySee all
Dr Gideon Lapidoth and Madeleine North
November 17, 2025


