This unique map shows which rivers are most polluted with plastic

Much of the 300 million tonnes of plastic produced every year makes its way to the ocean via rivers. Image: REUTERS/Darren Whiteside
Every year, approximately eight million metric tons of plastic enters the world’s oceans – the equivalent of one garbage truck of plastic every single minute.
Every plastic fork and bottle cap bobbing along the surface of the ocean has made its way to the ocean from dry land at some point. As it turns out, the hydrological cycle that keeps water circulating around the planet is also an effective means for trash to hitch a ride from our riverside cities to the open ocean.
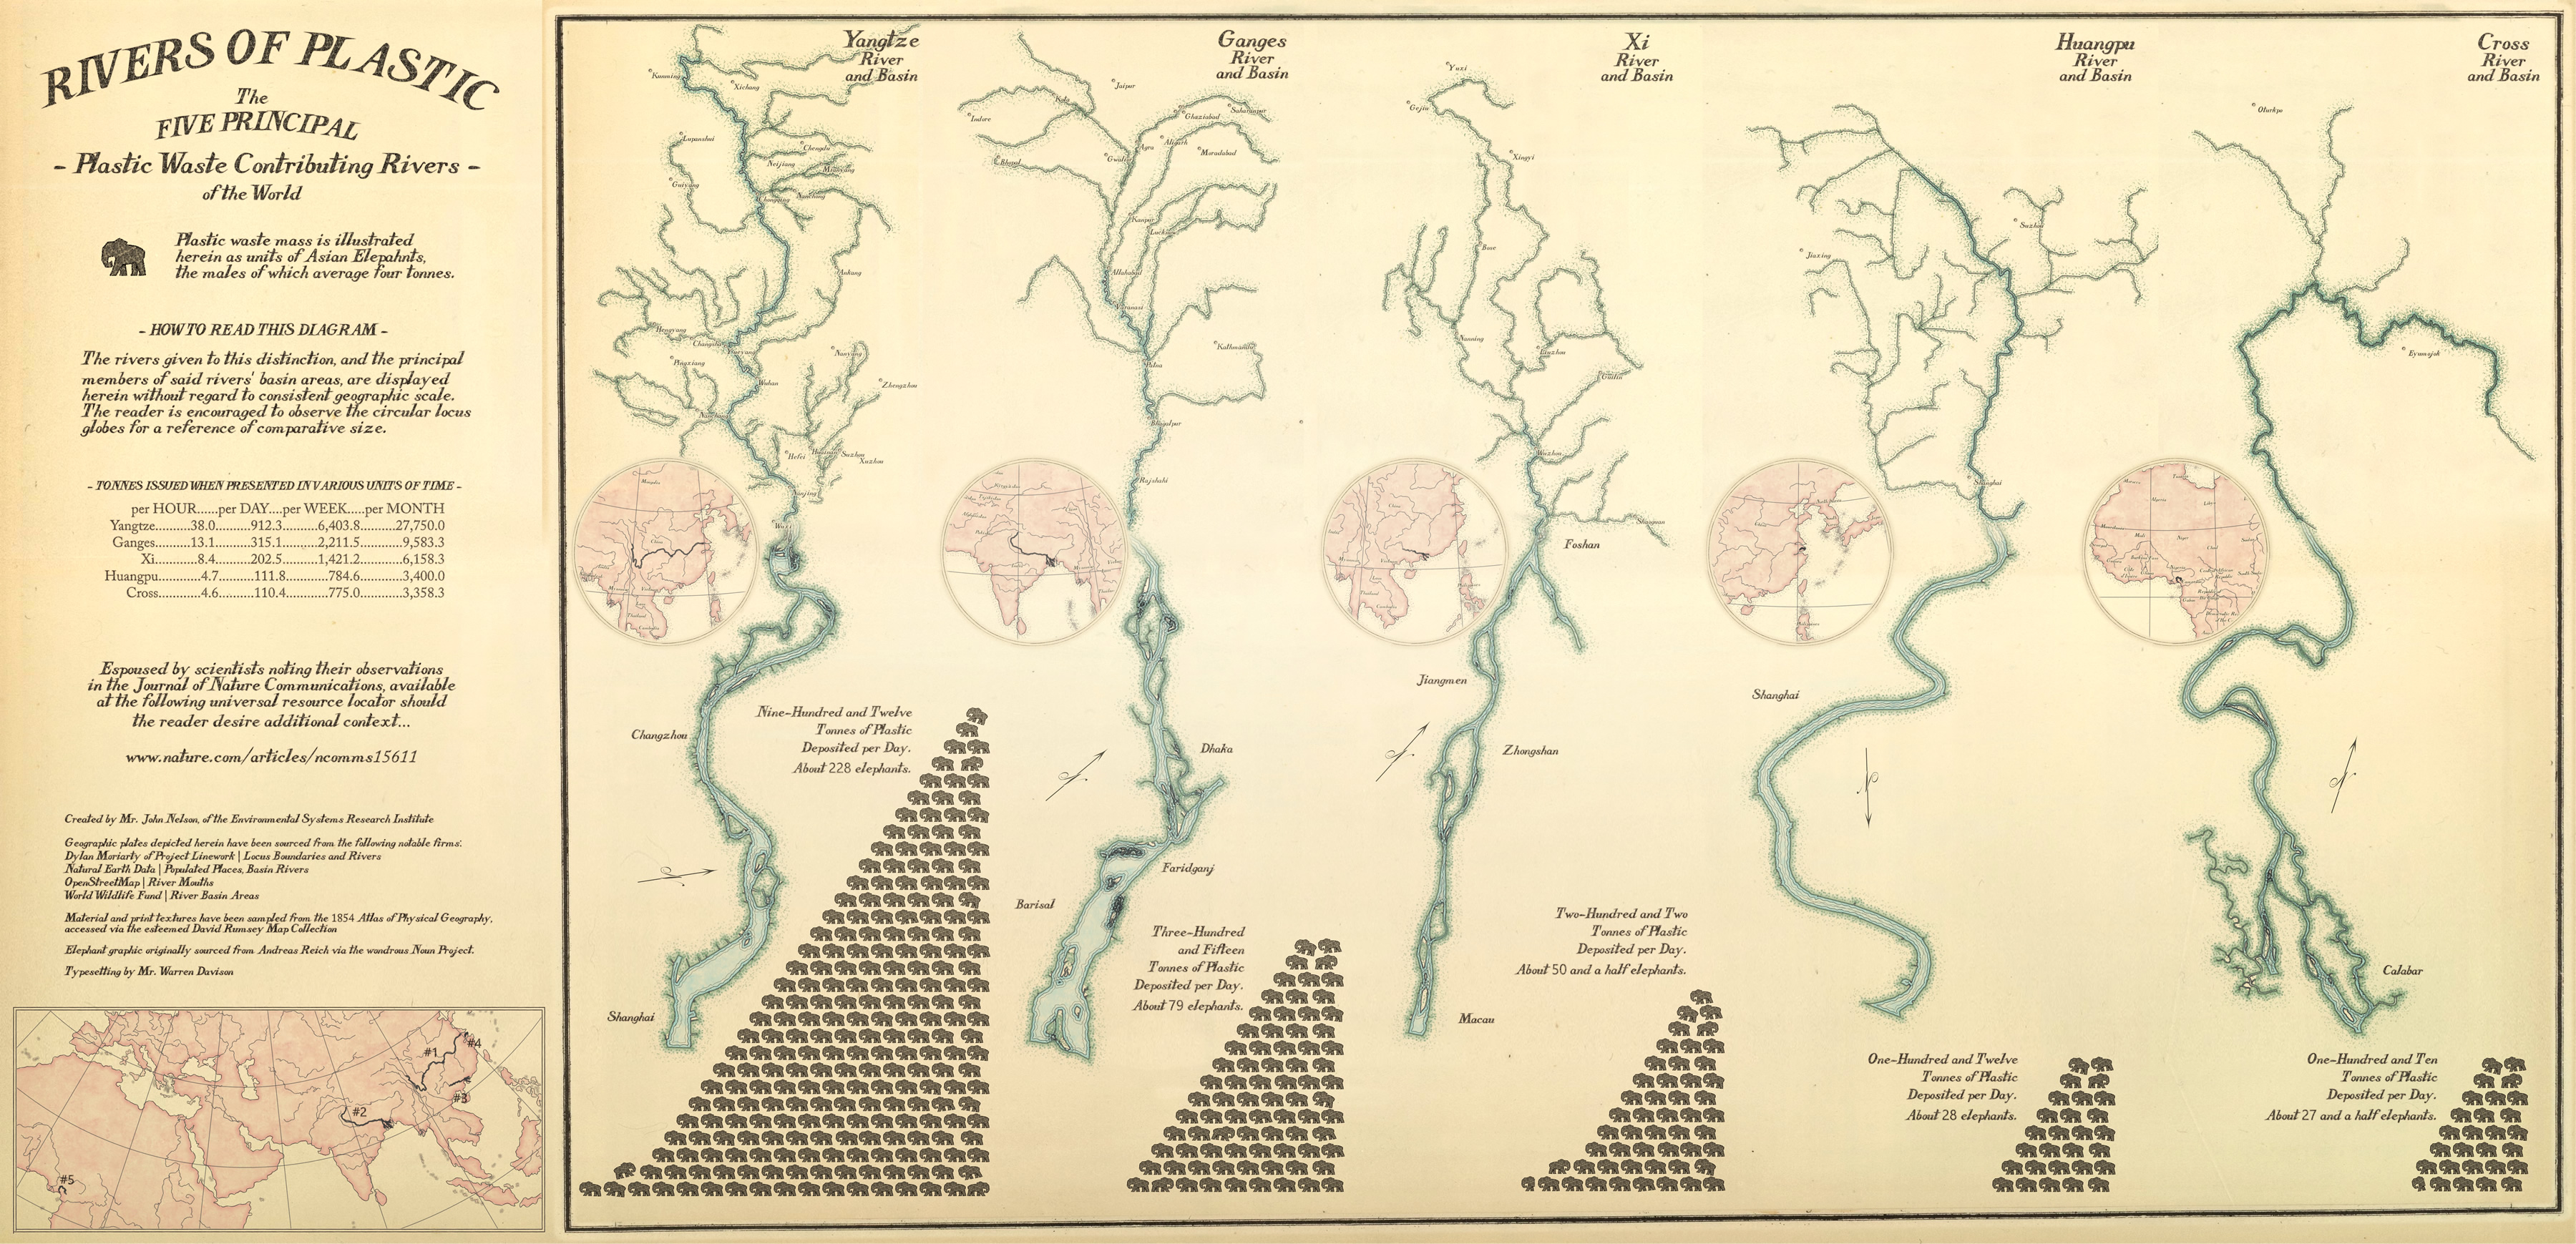
As today’s unique, vintage-themed map – via John Nelson at ESRI – visualizes the shocking amount of plastic emitted by major rivers in the world.
Plastic superhighways
It would be hard to overstate plastic’s influence on modern life.
Unfortunately, when plastic is finished doing it’s job, only 10% of it ends up being recycled. Instead, much of the 300 million tonnes of plastic produced each year ends up in the ocean, congregating in places like the Pacific Garbage Patch.
Plastic discharge is especially pronounced in large population centers along large rivers – particularly in rapidly urbanizing regions in China, Indonesia, and Nigeria.
Waste management practices are limited to non-existent in many of Asia’s fast-growing urban areas, so it comes as little surprise that 14 to the top 20 plastic emitting rivers are located on that continent.
The mighty Yangtze – China’s largest river – supports a population of over 400 million people and is the most prolific emitter of plastic waste on the planet. Over 1.5 million metric tons of plastic is unleashed into the Yellow Sea from the river each year.
Stemming the tide
Plastic emissions data makes one point clear – China is the key to decreasing the volume of trash entering our ocean ecosystems.
The good news is that the Chinese government has recognized the problem, mandating garbage sorting in nearly 50 cities and setting a target for at 35% recycling rate by 2020. A positive first step in the battle to stem the tide of plastic entering ocean systems.
Don't miss any update on this topic
Create a free account and access your personalized content collection with our latest publications and analyses.
License and Republishing
World Economic Forum articles may be republished in accordance with the Creative Commons Attribution-NonCommercial-NoDerivatives 4.0 International Public License, and in accordance with our Terms of Use.
The views expressed in this article are those of the author alone and not the World Economic Forum.
Stay up to date:
Water
Related topics:

Forum Stories newsletter
Bringing you weekly curated insights and analysis on the global issues that matter.
More on Nature and BiodiversitySee all

Mateo Labaki and Naeem Adam
June 30, 2026


