The big chart: How oil prices have reacted to world events since the 1980s
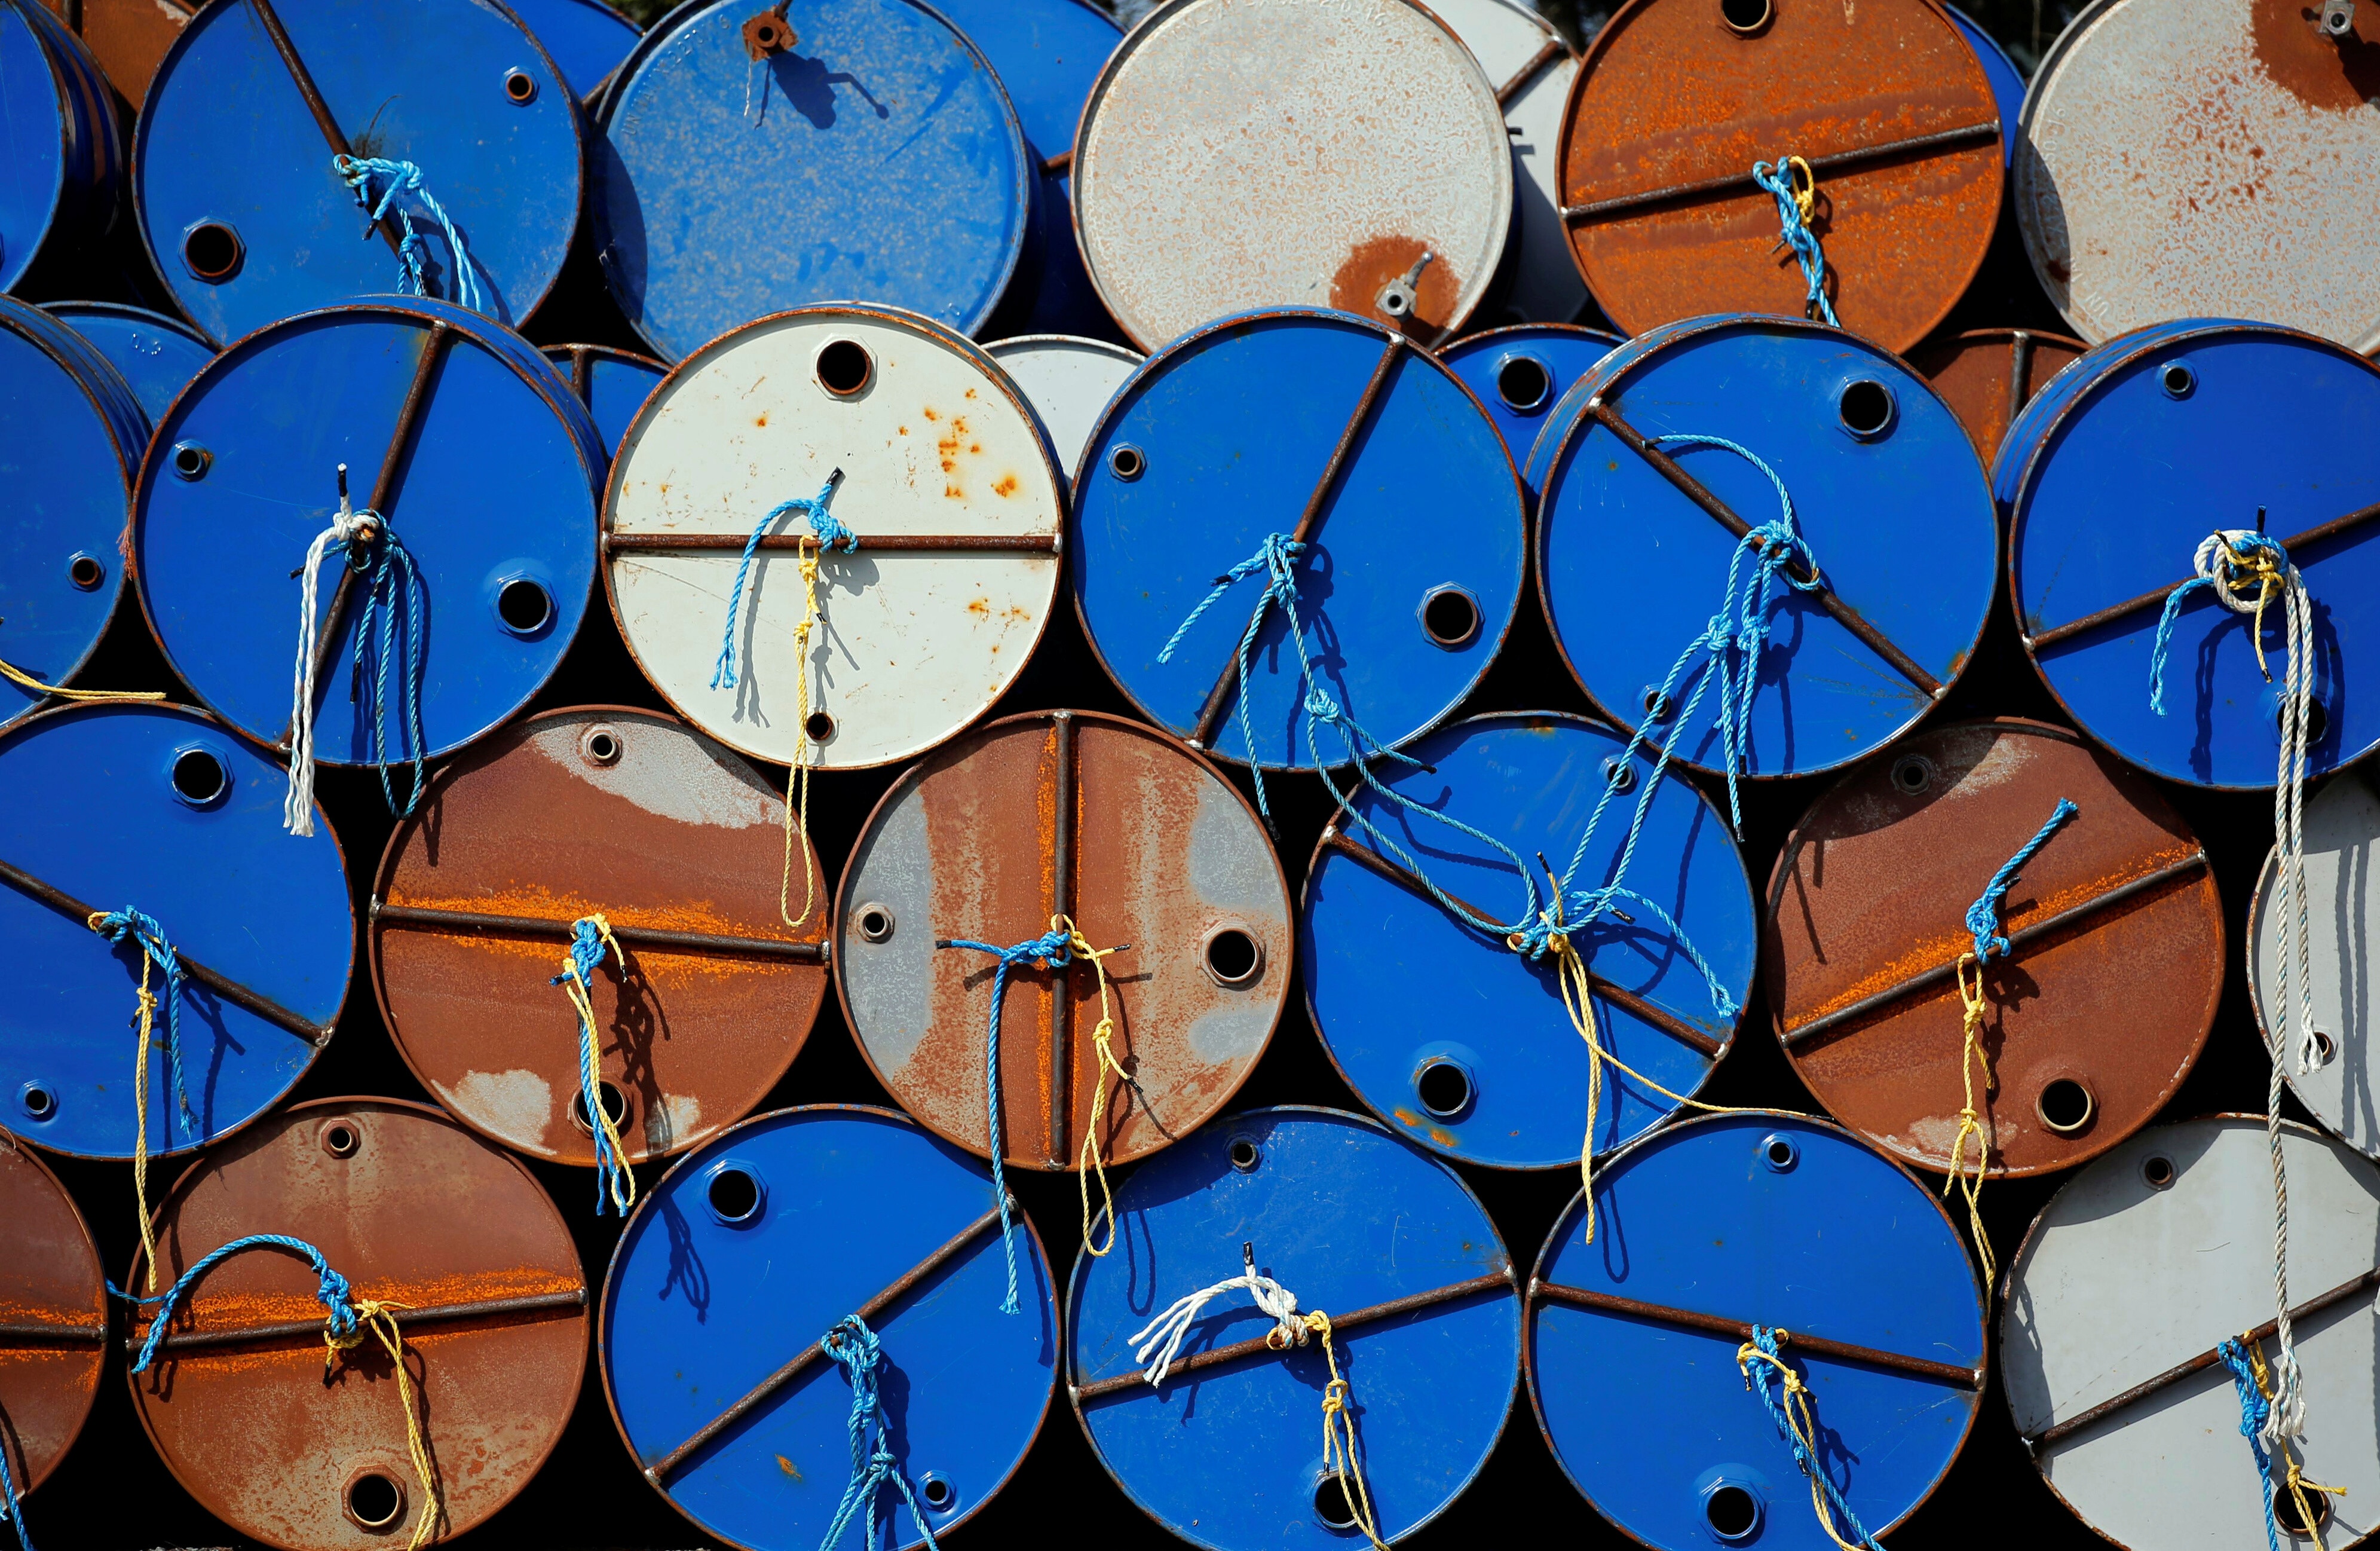
The price of a barrel of crude oil has fluctuated wildly since the start of the new millennium. Image: REUTERS/Regis Duvignau
- Oil prices have seen surges and drops since the US-Iran conflict began in February.
- But world events have always impacted the energy markets.
- This chart reveals how oil prices have shifted at key political and economic moments in recent history.
In a week in which the US Navy blocked Iran's ports, sending oil prices back up, and the International Monetary Fund warned that the world is on the verge of "an energy crisis on an unprecedented scale", we take a look at how the oil market has fluctuated over the past four decades - and how world events have influenced it.
As the chart below shows, the 2000s have witnessed a far more turbulent time for oil prices than the preceding two decades.
From the mid-1980s to the start of the new millennium, a barrel of crude oil averaged $20. But by 2005, when global oil spare capacity was at historically low levels, it was close to $60 and prices continued to climb steadily until reaching a peak of over $140 per barrel - just before the global financial crash of 2008.
Why did prices shift so dramatically during this period? Multiple factors were at play, including geopolitical tensions in the Middle East - where much of the world's oil reserves are located - increasing demand from emerging economies like China and India, as well as the US dollar dropping in value.
Following the financial crisis and the resulting recession, the Organization of the Petroleum Exporting Countries (OPEC) moved to stabilize falling oil demand by cutting a record 4.2 million barrels a day, with the price dropping from $141 in mid-2008 to $37 in January 2009.
Crude oil reached another peak in 2012, again due to a mixture of catalysts, including:
- US and EU sanctions on Iran to persuade the country to give up its nuclear programme
- Production disruptions in Syria, Sudan and Yemen
- US oil production reaching its highest level since 1998.
And the boom and bust cycle continued. The 2014-2016 oil price plunge was largely attributed to the US ramping up production of shale oil, flooding the market and eroding OPEC's power and reach. The World Bank said the period saw a 70% price drop - from $114 in June 2014 to $27 in January 2016 - and "was one of the three biggest declines since World War II, and the longest lasting since the supply-driven collapse of 1986".
Prices were then on the up again - reaching a peak of $73 per barrel in 2019 - before the COVID-19 pandemic sent them crashing back down to a low of $17 in 2020. Russia's invasion of Ukraine in 2022 skyrocketed them back up to a high of $127, similar to the current peak (of $123) caused by the ongoing US-Iran conflict.
Taken together, the statistics suggest oil prices behave like a macroeconomic barometer: conflicts and geopolitical tensions tend to push prices up, recessions and financial shocks tend to pull them down.
And as a new economy emerges - one driven by AI, geostrategic competition and the energy transition - we are likely to see further peaks and troughs in crude oil's trajectory.
License and Republishing
World Economic Forum articles may be republished in accordance with the Creative Commons Attribution-NonCommercial-NoDerivatives 4.0 International Public License, and in accordance with our Terms of Use.
The views expressed in this article are those of the author alone and not the World Economic Forum.
Forum Stories newsletter
Bringing you weekly curated insights and analysis on the global issues that matter.
More on Energy TransitionSee all

Abhinav Jindal and Gireesh Shrimali
July 15, 2026


